Design disciplines, like user experience (UX) design, have evolved to excel at devising experiences that make digital interfaces navigable. They accomplish this through a deep understanding of user needs and by mapping user journeys with meticulous attention to detail. The city represents a physical interface experienced by multiple users - residents, tourists, people of various ages and genders each experiencing it uniquely. In a time where digital interfaces are crafted for frictionless user experiences, why do many cities remain challenging to navigate?
For many years, often spoken in tones of anticipation and excitement, we have heard that 3D printing will revolutionize the architecture industry as we know it. But if we stop for a moment, reflect on the present and look back at the past, it becomes evident that the technology has long been reshaping the field, continuously undergoing profound transformations and ushering in new eras of design, construction and spatial creativity. Operating as a layer-by-layer additive manufacturing process, 3D printing uses digital models to create customized three-dimensional objects with a remarkable level of precision and efficiency, saving time, generating zero waste, reducing labor costs and opening avenues for rapid prototyping and iterative design. It enables architects to explore creative opportunities and regain autonomy by designing complex, non-standardized elements within an industrial and mass-customized process.
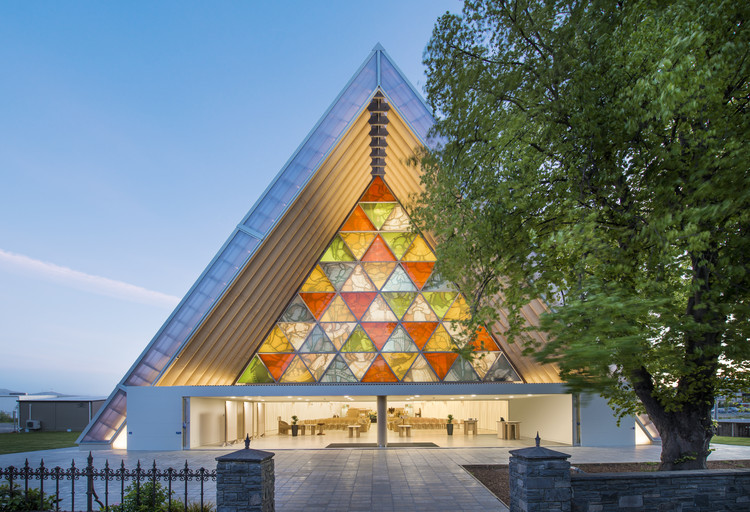
2014 Pritzker Laureate Shigeru Ban may be as well known for his innovative use of materials as for his compassionate approach to design. For a little over three decades, Ban, the founder of the Voluntary Architects Network, has applied his extensive knowledge of recyclable materials, particularly paper and cardboard, to constructing high-quality, low-cost shelters for victims of disaster across the world —from Rwanda to Haiti, to Turkey, Japan, and more. We've rounded up 10 projects of his humanitarian work, explained by Shigeru Ban Architects themselves.
Dealing with data analysis and communication is an important part when it comes to mediating between decision-makers and residents. Architect and Urbanist Lena Pak has developed a personal interest for data visualization in order to improve the communication process in a clear and effective way and she has shared with ArchDaily her last project based on the Pritzker Architecture Prize. A dynamic and interactive infographic that is meant to generalize information about the prize and to highlight curious facts of its distribution.
Glass is so present in our lives that it’s very difficult to think about the amount of work, experimentation and technologies behind each panel or glass object. It’s also impossible to separate innovations from modern architectural projects –from architects such as Mies Van der Rohe and Le Corbusier– from the advances of the glass industry.
We’re following the history of glass, from Mesopotamian artifacts to technological glasses, and we invite you to travel with us.
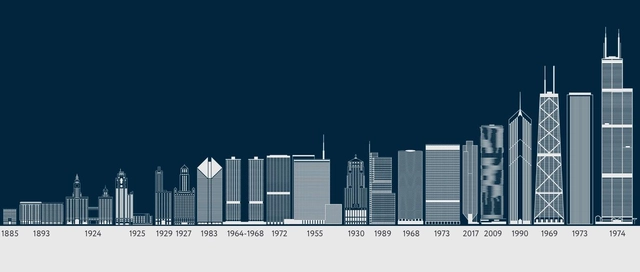
Mud City, the Windy City, the City of the Big Shoulders... If there is one thing we are certain of, it is that Chicago is the birthplace of exceptionally tall buildings.
To celebrate the city's ongoing innovations in soaring skyscrapers, Orbitz has illustrated 20 of Chicago’s most iconic sky-high architecture.
View the republished content from Orbitz' list complete with an interactive timeline of Chicago's tallest buildings.
Manhattan is known for its iconic skyline, brimming with skyscrapers, high rises, and some of the most impressive architecture in the world. But it wasn’t always that way; it took hundreds of years for New York City to become the structurally diverse, world-famous city that it is today.
https://www.archdaily.com/904180/100-years-of-change-in-new-yorks-skyline-1920-2020AD Editorial Team
The United States is a comparatively young country, but one with a rich and diverse history. From the ancient villages of New Mexico’s Pueblo people and the early Spanish settlers in Florida, to the Russian traders of Alaska and 19th-century missionaries in Utah, each of the 50 states has its own story to tell.
There’s no better way to trace this history than through buildings, which is why we’ve mapped out the oldest intact building in each US state. Whether they’re cottages, grand mansions, fortresses or churches, these historic sites offer us a glimpse into the early days of the regions. They help us to understand what brought early inhabitants to the state – and what their lives might have been like.
Ever wondered about the hardest and softest woods in the world? As architects, we're all pretty familiar with the softest: Balsa. Its material qualities are what make it so attractive to make models. But what about the the strongest wood in the world? Ever pondered just how many pounds or kilos of force they can withstand?
https://www.archdaily.com/895767/75-types-of-wood-ranked-by-hardnessAD Editorial Team
If you were to identify, categorize and map the 21st century’s emergent architectural practices from the world over, all on one diagram, what would it look like? Considering how the current architectural landscape consists of several different approaches, attitudes and political stances, how would you map them without being too reductive? And how would you ensure that out of hundreds of emergent practices and firms across the globe, you don’t leave anyone out? Perhaps the Global Architectural Political Compass V 0.2 could offer a clue.
Created by Alejandro Zaera-Polo and Guillermo Fernandez-Abascal, the diagram is part of an ongoing inquiry into “the state of the art in (global) architectural practice” [1]. In 2016, Zaera-Polo explored the subject in a comprehensive essay for El Croquis titled “Well into the 21st Century” in which he set down the framework for 11 political categories that now form the compass diagram.
https://www.archdaily.com/882843/have-your-say-on-the-landscape-of-emerging-practices-with-the-interactive-architectural-political-compassZoya Gul Hasan
Nathan Yau collected US Census data between 1950 and 2015 to create a set of visualizations that demonstrate how the diversity of the workforce has evolved. "Naturally, men and women now work many of the same jobs, but many jobs are mostly men or mostly women," explains Yau. So how does the architecture profession fit into this narrative?
https://www.archdaily.com/880865/in-a-male-dominated-field-women-make-up-only-30-percent-of-architects-in-usaAD Editorial Team
If you find yourself always looking up the same information, or if you're just starting out and you need to have the basics handy, this post is for you. There are hundreds of these helpful guides floating around on Pinterest—and if you want to venture further into interior design or more towards engineering, you're covered! We selected the best and most useful architecture and interior design infographics so that your next project is on point.
Chicago is one of the most architecturally rich cities in the world with the history of modernism embedded in its skyline. From the Willis Tower to the Aqua Tower, the skyscrapers of Chicago have led the development of tall buildings, the city becoming a breeding ground for innovations in structure and design. The Windy City has solidified itself among other metropolitan giants like New York and London as having one of the most recognizable skylines in the world.
This new infographic by Chicago Line Cruises offers a look at some of the most visible figures in Chicago’s skyline, with embedded information on each of the buildings. View the infographic after the break.
All over the world, projects are being built. From pavilions to skyscrapers, the range of scales is tremendous, and even among the multitude, some projects stand head and shoulders above the rest in terms of sheer size, cost, and ambition. The following infographic collects eight of the largest projects that are currently in construction all over the world. With countries like Egypt, the United Kingdom, China, and The United Arab Emirates represented, they showcase a definite diversity while supporting the trend of extreme growth throughout Asia and the Middle-East that has been prevalent in the past decade - the UAE alone hosting three of the eight projects.
Some projects comprise multiple buildings – the Yas Island Complex in Abu Dhabi already features landmarks like the Yas Island Yacht Club and the Yas Hotel - while others are a single, massive piece of infrastructure like the Great Man-Made River Project in Libya. See them all after the break.
Use the flowchart to find out which software is your perfect fit (click to enlarge). Image Courtesy of ArchSmarter
One of the biggest decisions to make when setting out alone - either as an independent architect or starting your own firm - is which software to use. It can be tempting to simply choose an industry leader, but you may end up paying over the odds for a product which doesn't suit your style. In this post, originally published on ArchSmarter as "Which architectural software is right for me?" Michael Kilkelly works through the factors that should influence your decision, whether you're making it for the first time or reviewing a choice you made long ago.
Which CAD or BIM software should you use? Well, that depends. What functionality to you need? What are your priorities with regard to cost, comparability, interoperability? Are you using a Mac or a PC?
Graphic artist and designer Martin Vargic of Halcyon Maps has created a fascinating set of infographics that showcase both the cultural typologies of each continent's architecture as well as the evolution of its tallest buildings throughout history. Exploring the progression of height differences of the tallest buildings in Europe, North America, Asia, Africa, South America, and Oceania, Vargic's visually-striking charts detail 5,000 years of building history, from ancient to modern times.
Seven years ago today, ArchDaily was launched with one mission: to provide inspiration, knowledge and tools to the architects who are challenged with designing for the world's next 3 billion urban inhabitants. With two guiding principles in mind - that little-known architects should be able to rub shoulders with architecture greats, and that all of this should be free and accessible to everybody - we set about on a path that would eventually lead us to become the world's most visited architecture website, with over 350,000 daily readers.
Selected by votes from over 31,000 architects and architecture enthusiasts around the world, the winners of the 2015 Building of the Year Awards represent the best architecture of the past year. By using the intelligence of the crowd to judge over 3,000 entrants the awards provide a refreshing antidote to the decisions of expert juries. As a result the winners include Pritzker Prize winners such as Álvaro Siza, Herzog & de Meuron and Shigeru Ban, but also up-and-coming practices such as OTO, sporaarchitects and EFFEKT, and even dynamic collaborations such as the housing complex designed by a team of CEBRA, JDS, SeARCH and Louis Paillard Architects.
With 14 winners, designed by a total of 18 practices and built in 12 countries across 5 continents, the process of recognizing these stunning buildings was truly a global effort. Learn more about the 2015 BOTY Awards and this year’s winners by checking out our AD original infographic, presented by ArchDaily and our partners at HP, after the break.
It may or may not be the tallest building in North America, but one thing's for sure: when it comes to costs, no other skyscraper comes close to New York's One World Trade Center. This is the conclusion of Emporis, whose list of the world's top ten most expensive buildings puts 1WTC way out in front at $3.9 billion. Originally estimated at just half that cost, this sets a trend in the top ten list, with many of the featured buildings suffering staggering overruns. The second-place Shard, for example, overshot it's original £350 million ($550 million) budget nearly four times over (although this is to be expected in London).
With more than 7 billion people now alive, the greatest population growth over the last century has occurred in urban areas. Now, a new series of interactive maps entitled "The Age of Megacities" and developed by software company ESRI allows us to visualize these dramatic effects and see just how this growth has shaped the geography of 10 of the world’s 28 megacities. Defined as areas with continuous urban development of over 10 million people, the number of megacities in the world is expected to increase, and while Tokyo still tops the list as the world’s largest megacity, other cities throughout Asia are quickly catching up. Find out more after the break.
Using information collected from the US Census Bureau’s American Community Survey, the Hamilton Project at The Brookings Institution has created a set of interactive infographics comparing the lifetime earning potential of graduates of 80 majors. With so much debate over the earning potential of architects, the tool provides us with an invaluable insight into the long-range outlook for members of our profession, charting the both the total lifetime earnings of architects and their average earnings per year over a 42-year career.
Read on after the break for analysis of what the infographics tell us
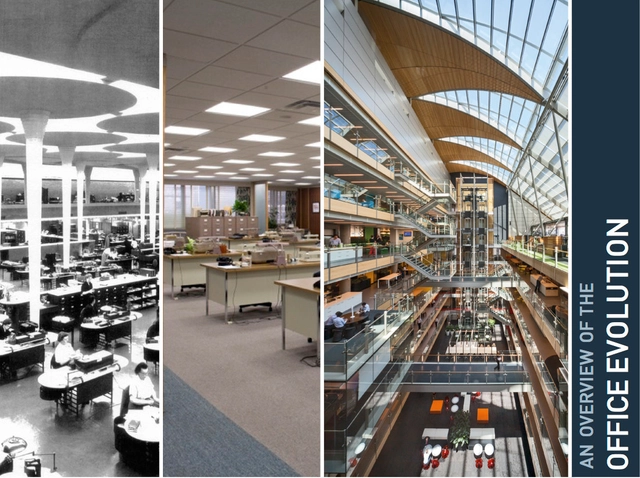
Learn about the evolution of the workplace, from the very first office developed by the De Medici family to today's open collaboration spaces, after the break!
https://www.archdaily.com/517945/infographic-the-evolution-of-the-officeSunica de Klerk
Courtesy of Civil Engineering Program, Norwich University
For time immemorial, humanity has sought to outdo itself architecturally, building longer tunnels, taller towers, and stronger walls. Now, the Master in Civil Engineering program at Norwich University has compiled a definitive top ten list of these impressive structures. In the following infographic, you’ll find some familiar entries - such as the Great Wall of China and the Hoover Dam - as well as some lesser known greats, like the Qingdao Haiwan Bridge. Spanning over 2000 years of architectural ingenuity and invention, this list is sure to teach you something new about the most impressive engineering projects of all time.
With no casualties, last week's fire at the Glasgow School of Art, which caused significant damage to parts of the building and gutted Charles Rennie Mackintosh's canonical library room, will be remembered as a tragic event that robbed us of one of the best examples of Art Nouveau of its time. The intention of the Glasgow School of Art is to restore the building in the hope that in generations to come, the fire will be all but forgotten, a strategy which has been largely well received by the profession.
However, in the case of other fires things have not gone so smoothly: for millennia, fire has played a big role in determining the course of architectural history - by destroying precious artifacts, but often also by allowing something new to rise from the ashes. Read on after the break as we count down the top 10 fires that changed the course of architectural history.


")
")
")
")


: The Palazzo. Image © Ed Lewis")
: The Shard. Image © Eric Smerling")