For many years, often spoken in tones of anticipation and excitement, we have heard that 3D printing will revolutionize the architecture industry as we know it. But if we stop for a moment, reflect on the present and look back at the past, it becomes evident that the technology has long been reshaping the field, continuously undergoing profound transformations and ushering in new eras of design, construction and spatial creativity. Operating as a layer-by-layer additive manufacturing process, 3D printing uses digital models to create customized three-dimensional objects with a remarkable level of precision and efficiency, saving time, generating zero waste, reducing labor costs and opening avenues for rapid prototyping and iterative design. It enables architects to explore creative opportunities and regain autonomy by designing complex, non-standardized elements within an industrial and mass-customized process.
Ah, clients. Sadly, we can't all be paper architects, dreaming up improbable futures (and even the members of Archigram eventually settled down to found studios that actually build stuff). As a result, we're forced to work with people who often think that just because they're paying for our services, they own us like slaves. They come in many different varieties, from the client that thinks that everything is an emergency to the client that obsesses over the design budget. The following infographic produced by "startup studio and accelerator" Coplex will help you diagnose your own clients—and more importantly, offers some tips on how best to deal with them to make your life easier.
https://www.archdaily.com/876803/15-clients-you-will-encounter-as-an-architect-and-how-to-deal-with-themAD Editorial Team
How satisfied are you with your city’s garbage service? Its parks? The way it handles pest control? What about homelessness? In the USA’s largest metropolis, which covers a total of 468.484 square miles (1,213.37 km2) and is home to over 8.5 million people, New Yorkers’ perception of their city and the services it provides reveals the “uneven distribution of New York’s opportunities,” according to a survey conducted by The New York Times.
The project also shows relative accord and satisfaction with fire and emergency medical services and agreement that use of tax dollars, public housing and traffic can be improved.
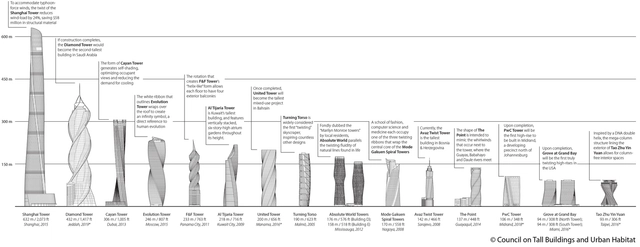
The past ten years have seen a new twist in tall building design: buildings that rotate as they rise, either for engineering or purely aesthetic purposes. Inspired by this recent trend, the Council on Tall Buildings and Urban Habitat (CTBUH) has produced a new graphic entitled Tall Buildings in Numbers “Twisting Tall Buildings” to analyze the “recent proliferation of twisting towers creating a new generation of iconic buildings throughout the world.”
The infographic compares the buildings by height, along with the tightness and total degrees of their rotation. Continue after the break for the full graphic and links to the projects on ArchDaily.
From the Cradle of Civilization in ancient Mesopotamia to the modern urban explosion in China, cities are among the most obvious and dramatic evidence of human existence. In a recent paper published in Scientific Data, a team led by Yale University researcher Meredith Reba mapped the emergence of cities between 3,700 BC and 2,000 AD based on when their populations were first recorded in historical accounts.
Taking the data from this study, Max Galka of Metrocosm has produced this fascinating animation showing the history of cities worldwide. "Most datasets available go back only a few years or decades at most. This is the first one I've seen that covers 6 millennia," Galka told CityLab. "I'm a big fan of history, so after reading the study, I thought it would be interesting to visualize the data and see if it offers some perspective." The steady flow of time may seem a little slow at first, but stick with it through the early BC years and the shifts in urban development start to get intriguing. And—spoiler alert—buckle up as you approach the 20th century.
What type of architecture do dictators prefer? What would a subway map of the affairs of famous architects look like? What is the current state of gender and ethnic diversity within the profession? Which architects would win a color war, Dutch or American? Archi-Graphic places architecture on the operating table, using infographics to cut a visual cross-section that answers these questions and many more.
Maruf Raihan, founder of Bangladeshigraphic design firm Studio Biporit has created an infographic tracing the career of Muzharul Islam, widely recognized as the Master Architect of South Asian Modernism. The timeline begins with Islam's birth in Murshidabad in 1923, spanning from his first major project— the Central Library at the University of Dhaka, in 1953— to his last, the World Bank Office in Dhaka in 1987. Also documented are his numerous academic and architectural milestones, including extensive international publication and exhibition. Highly legible and amply illustrated, the infographic concludes with an entry noting Islam's death in 2012, at the age of 88. The full-sized graphic can be viewed here.
Selected by votes from over 31,000 architects and architecture enthusiasts around the world, the winners of the 2015 Building of the Year Awards represent the best architecture of the past year. By using the intelligence of the crowd to judge over 3,000 entrants the awards provide a refreshing antidote to the decisions of expert juries. As a result the winners include Pritzker Prize winners such as Álvaro Siza, Herzog & de Meuron and Shigeru Ban, but also up-and-coming practices such as OTO, sporaarchitects and EFFEKT, and even dynamic collaborations such as the housing complex designed by a team of CEBRA, JDS, SeARCH and Louis Paillard Architects.
With 14 winners, designed by a total of 18 practices and built in 12 countries across 5 continents, the process of recognizing these stunning buildings was truly a global effort. Learn more about the 2015 BOTY Awards and this year’s winners by checking out our AD original infographic, presented by ArchDaily and our partners at HP, after the break.
Bauhaus, the school of design established by Walter Gropius in Weimar in 1919, has arguably been the most influential of any institution in shaping the trajectory of modern architecture. Out of this single school came an entire movement that would have lasting effects on architectural pedagogy and the design of everything from buildings to road signs. Born out of a larger cultural movement following Germany’s defeat in World War I which left the country ripe for regrowth without the previous constraints imposed by censorship, the core of Bauhaus philosophy were the principles of craftsmanship and mass production, which allowed for the movement’s rapid proliferation and a production model that would later inform contemporary design companies such as Ikea. Check out the infographic from Aram below to learn more about the movement, tracking the school from its origins in Weimar, via its canonical Gropius-designed home in Dessau, to its continuing legacy today.
Courtesy of Ohio University’s Online Masters in Civil Engineering program
With everything from beams, to trusses, to arches and more, bridge technology has informed advanced structural systems used in architecture for centuries. This infographic produced by Ohio University’s Online Masters in Civil Engineering programexamines five historic and contemporary examples of bridge technology, concisely revealing how different structural techniques for bridges have achieved radically different aesthetics - from stone slabs first laid over water in the middle ages to modern-day suspension bridges. To learn more about ten key examples of the five major bridge types, each with additional information on their origins and history, see the full infographic after the break.
By now, when the design competition for the Guggenheim Helsinki is mentioned, one number probably comes to mind: 1,715, the record-breaking number of submissions which the competition received. But how can this number be put into perspective? Why, with more numbers of course. Take 5,769 for example, which is the total height in meters of all the A1 presentation boards arranged vertically. Or take 18,336,780, the estimated value in Euros of all the work submitted.
How do architects stack up against other professions on male/female ratio? Recent data on workers in the United States reveals some compelling information on where women are working - and where men hold sway. Construction work leans heavily male, while research and analyst work is led by women. Where does architecture fit on the scale? See the full infographic showing the percentage of men versus women in architecture after the break.
With more than 7 billion people now alive, the greatest population growth over the last century has occurred in urban areas. Now, a new series of interactive maps entitled "The Age of Megacities" and developed by software company ESRI allows us to visualize these dramatic effects and see just how this growth has shaped the geography of 10 of the world’s 28 megacities. Defined as areas with continuous urban development of over 10 million people, the number of megacities in the world is expected to increase, and while Tokyo still tops the list as the world’s largest megacity, other cities throughout Asia are quickly catching up. Find out more after the break.
One thousand nine hundred and ninety: the percentage by which the $3 billion Montreal Olympic Stadium - a project designated only $148 million in 1973 - exceeded its original budget. Ten: the number of years that the Sydney Opera House was over its deadline. Twenty-four: the number of projects included in Monumental Budget Busters, an interactive infographic ranking an array of works - ranging from the International Space Station to the Sochi Olympics - from smallest to largest in cost and time overruns. The list includes infrastructure, architecture, and governmental projects with budget overruns ranging from $210 million to $68 billion. These costs beg the question - does the end justify the means? Find out with the interactive infographic after the break.
Using information collected from the US Census Bureau’s American Community Survey, the Hamilton Project at The Brookings Institution has created a set of interactive infographics comparing the lifetime earning potential of graduates of 80 majors. With so much debate over the earning potential of architects, the tool provides us with an invaluable insight into the long-range outlook for members of our profession, charting the both the total lifetime earnings of architects and their average earnings per year over a 42-year career.
Read on after the break for analysis of what the infographics tell us
Ever wonder what software skills and licensure/accreditation are required to get a job at the top 50 Architecture firms in the world? Our study has compiled it all...
We surveyed 928 job postings at the top 50 architecture firms, based on Architectural Record's July 2013 Top 300 Architecture Firms study, and compiled the software requirements and the licensure/accreditation requirements listed for each job. We then sorted them by average, and then by the experience level required, from 0-3, 4-10 and 11-20+.
Last week, Frei Otto was announced as the 40th recipient of the Pritzker Prize, the latest in a long line of talented architects (as well as the first architect to ever receive the Prize posthumously). Learn more about the Prize and its winners after the break!

")
")
")
")


.jpg?1416794800&format=webp&width=640&height=580)


-thumb.jpg?1426868224&format=webp&width=640&height=580)