“Can you help me design my residential tower? It's 30 stories and located in Brooklyn, New York.” ChatGPT’s response may be surprising. Given that the bot has no architectural experience, and is certainly not a licensed architect, it was quick to rattle off a list of considerations for my building. Zoning codes, floor plan functionality, building codes, materiality, structural design, amenity spaces, and sustainable measures were just a few of the topics ChatGPT shared information about.
Envision your ideal neighborhood. Maybe it’s on a cul-de-sac in the suburbs, where every neighbor has a well-manicured lawn, a two-car garage, and everyone gives each other a friendly wave on their way to work. Or maybe you live in a high-rise building in a dense urban center, where you take public transit to the office five days a week and say hello to your doorman on your way out. Whatever your neighborhood might look like, there’s always a sense of wanting to know the people who live around your- or at least an unspoken reliance on one another to ensure that your surroundings are safe. What happens when technology brings you and your neighbors together to report on local happenings? Is it a good thing, or does it create a vigilante situation gone awry?
El poder de la Data - Mirador. Image Cortesía de Online Lab of Architecture (OLA)
The Power of Data is an exhibition created in a virtual building, conceived by three-dimensional geometries based on various artificial intelligence algorithms. The project was created by the OLA (Online Lab of Architecture) team of research architects formed by Jennifer Durand (Peru), Daniel Escobar (Colombia), Claudia Garcia (Spain), Giovanna Pillaca (Peru) and Jose Luis Vintimilla (Ecuador).
Intro GPS systems and Location Based Services give access to an important amount of data that is currently being used mostly for traffic analysis - but which, if properly processed, could open up infinite possibilities for planning.The access to these Mobility Big Data is no longer a privilege of large cities; on the contrary, it is possible to effectively apply the technologies to increasingly more diverse territories, from mega-regions to contained districts and cities. These data, when retrospectively compared to previously collected ones, lend themselves to multiple applications loosely related to the traffic issue, such as socio-demographic or economical studies. Systematica opens the doors of its laboratory to show us what are the potentials and limits of these tools, starting from a direct experience - a research project, developed in the Los Angeles area.
For the 2019 Shenzhen Biennale of Urbanism\Architecture (UABB), titled "Urban Interactions," (21 December 2019-8 March 2020) ArchDaily is working with the curators of the "Eyes of the City" section to stimulate a discussion on how new technologies might impact architecture and urban life. The contribution below is part of a series of scientific essays selected through the “Eyes of the City” call for papers, launched in preparation of the exhibitions: international scholars were asked to send their reflection in reaction to the statement by the curators Carlo Ratti Associati, Politecnico di Torino and SCUT, which you can read here.
Big Data refers to data that, due to its quantity and complexity, requires specific applications in order to be processed. New trends in urbanism, data collection, and management, not to mention the development of new platforms and tools, have given rise to a new era in urban analysis, creating new resources to understand, evaluate, and manage the evolution of cities.
In the highly connected world we live in, technology influences and impacts almost every decision we make. Big Data, Artificial Intelligence (AI), and the Internet of Things (IoT) have enhanced our connected world and helped us understand more about the spaces we inhabit. Aside from the smart homes and smart appliances we have become accustomed to, the modern day office is being redesigned and reprogrammed to include a variety of smart technology systems. The goal of these systems is to put our offices to work and empower businesses to better understand their design decisions, real estate investments, and most importantly- their own employees.
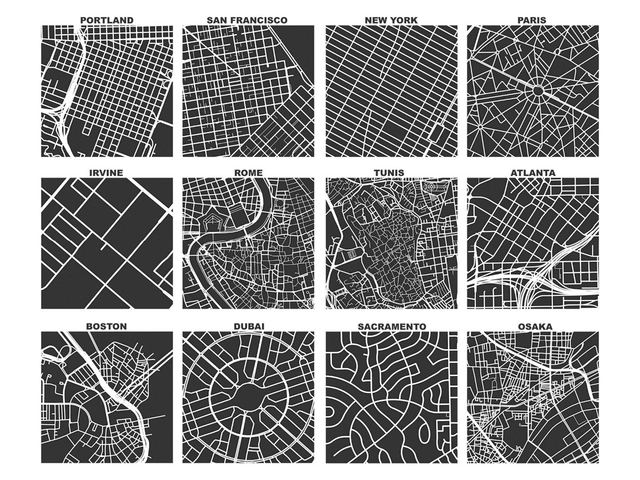
Regardless of where you live or work or who you’re friends with, you usually move around the same neighbourhoods and streets of your city. It may be London, Santiago, Shanghai, or Moscow, but in any of these places, there are always districts you have never set a foot in. Have you ever considered how many ‘cities’ are within your own city?
A research article published in The Royal Society Open Science and signed by Chilean researchers utilizes big data to analyze and visualize urban segregation, delivering spatial tools that allow us to develop strategies in a city of many cities. "We know there are [social] bubbles in Santiago, Chile, and that therefore, there is segregation," says Teodoro Dannemann, co-author of the research paper The time geography of segregation during working hours, in a conversation with ArchDaily. “We know that each person explores only a small fraction of the city, which is basically the home-work trajectory. This implies that we only engage with a small group of citizens," he adds.
The Analytics and Insight unit at Zaha Hadid Architects (ZHA) has developed data-driven space-planning models for workplaces that can be changed or adapted in real time. The team, led by architect Uli Blum and Arjun Kaicker, applies their research directly to ZHA projects, including the Sberbank Technopark at the Skolkovo Innovation Centre, Moscow, Russia (seen here), and the Galaxy SOHO Beijing, which was built in 2012. Image
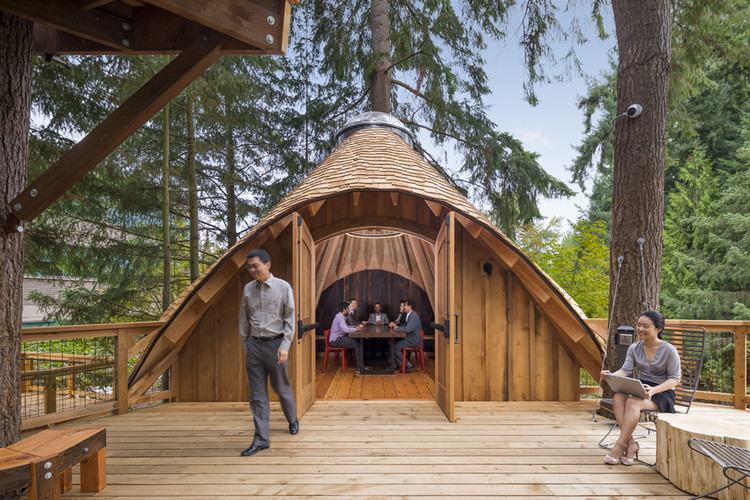
A workplace that improves employee productivity and efficiency has been a white whale of corporate managers for decades. But even before the office as we know it today was born, designers and innovators were already studying sites of labor, such as the factory, to devise strategies to boost worker performance. By the 1960s, Robert Propst, the inventor behind Herman Miller’s Action Office line of workplace furniture, and others were conducting workspace research that would ultimately lead to the creation of the modern cubicle.
These developments relied largely on observation and intuition to organize office workers in purportedly effective ways. Now, advances in technology allow designers to take a more sophisticated approach, using sensors, internet-connected furniture and fixtures, and data analytics to study offices in real time. “You can take into account every single employee, and people are very different,” says London architect Uli Blum. “It’s about solving the fundamental problems of getting people the environment they need. And the easiest way is to ask them,” he adds. But finding out the needs of hundreds, sometimes thousands, of workers can quickly become an exercise in futility.
Before airplanes, it took mail carriers on horseback months to transport letters across the country. Before washing machines, it took a full day of physical exercise to wash and dry a family’s laundry. And before cranes, it took decades—sometimes centuries—to build large structures such as castles and cathedrals.
The point being: Whatever you do, technology probably gives you a better way to do it.
Microsoft is undertaking an ambitious overhaul of its 800 offices around the world and uncovering great insights about the intersections of technology and workplace design in the process. The technology giant’s global director of workplace strategies, Riku Pentikäinen, speaks to Metropolis’s Avinash Rajagopal about the company’s new workplaces, collaborating with designers and furniture manufacturers, and how his team takes a data-driven approach to office design.
Ideasforward wants to give young creative people from around the world the opportunity to express their views on the future of societies through their innovative and visionary proposals. We are an experimental platform seeking progressive ideas that reflect on emerging themes.
Responding in part to recent debates on how big data will affect our built environments, Synthesis Design + Architecture have teamed up with IBM Watson Analytics to design an interior feature wall for the Watson Experience Center in San Francisco. The project, named Data Moiré after the dizzying patterns created by overlapping sets of lines, uses data from the influence of mobile phones on monthly consumer spending to create a precise screen material that defines the wall.
On Thursday, December 22nd, an email arrived in the inboxes of ArchDaily’s editors that made us sit up, shake off our holiday-induced lethargy, and take notice. MASS Design Group’s Year in Review email might initially have blended in with the many other holiday wishes and 2016 recaps we receive at that time of year—it recapped such highlights as Michael Murphy’s TED Talk in February or the launch of the first African Design Center—but it had one thing that we hadn’t seen from other firm’s years-in-review: detailed statistics about the firm’s achievements that year.
In recent decades, certain aspects of architecture have become increasingly open to scientific analysis, most notably when it comes to a building’s environmental impact. It’s no surprise, therefore, to see MASS Design Group’s claims that their work uses 74% less embodied carbon than typical building projects, or that 78% of their materials are sourced within 100 kilometers, but alongside these were some more unusual metrics: since it was founded, the firm has invested 88% of construction costs regionally, created 15,765 jobs, and in 2016 alone, their work served a total of 64,580 users. These numbers suggest a way of thinking about architecture that few have attempted before—a way that, if widely adopted, could fundamentally change the way architecture is practiced and evaluated. We spoke to MASS co-founder Alan Ricks to find out how these statistics are calculated, and what purpose they serve.
Once a photograph is uploaded to social media, it ceases to be part of one’s private archive and becomes public property – as well as an object of study for researchers. There have been many attempts to study photographs on the scale of "Big Data." Take, for example, the numerous and well-publicised projects by Lev Manovich’s Big Data Lab. Evidently, using the results of one study of the huge online archive of photographs to make conclusions about society at large, is not necessarily a good idea. It’s fair to say that our society is not evenly represented online: a 19-year old woman may be posting her selfies daily, but it doesn’t mean that same goes for a sixty-five year old man. That said, we can learn a lot about cities and their inhabitants from the results of studies such as these.
Parallelism in Architecture, Environment And Computing Techniques, (PACT)
The theme of Parallelism in Architecture, Environment and Computing Techniques (PACT) 2016 explores the relations between computational design in architecture, organizational and global, ever-changing and pervasive contexts. PACT 2016 aims to gather practitioners and researchers interested in investigating and improving the state of practice of computational design software in the architectural discourse, where practicing design computing experts can explain the challenges they face in their day-to-day practices, and collectively induce an impact on the future of the field.
For a number of years now, Smart Cities and Big Data have been heralded as the future of urban design, taking advantage of our connected, technological world to make informed decisions on urban design and policy. But how can we make sure that we're collecting the best data? In this story, originally published on Autodesk's Redshift publication as "'Array' of Possibilities: Chicago’s New Wireless Sensor Networks to Create an Urban Internet of Things," Matt Alderton looks at a new initiative in Chicago to collect and publish data in a more comprehensive way than ever before.
If it hasn’t already, your daily routine will soon undergo a massive makeover.
For starters, when your alarm clock goes off, it will tell your coffeemaker to start brewing your morning joe. Then, when you’re on the way to work, your car will detect heavy traffic and send a text message to your boss, letting her know you’ll be late. When you arrive, you’ll print out the agenda for today’s staff meeting, at which point your printer will check how much ink it has left and automatically order its own replacement cartridges.
At lunch, you’ll think about dinner and use your smartphone to start the roast that’s waiting in your slow cooker at home. And when you come home a few hours later, your house will know you’re near, automatically turning on the lights, the heat, and the TV—channel changed to the evening news—prior to your arrival. It will be marvelous, and you’ll owe it all to the Internet of Things (IoT).
Videos
The new Watches of Switzerland store in London designed by Callison. Image Courtesy of Callison
With the rise of the internet, old-fashioned brick-and-mortar stores have struggled, as online ordering services have increasingly made it unnecessary to actually go to a store. The answer for the physical stores of the future? Make spaces not for purchasing the things people need, but experiencing the things people want, as explored in this article by Matt Alderton originally published on Autodesk's Redshift publication as "How Technology and Big Data in Retail Are Shaping Store Designs of the Future." Alderton looks at how forward-looking stores are being designed to appeal to customers, finding that the same technology revolution that threatened to make stores obsolete might also play a key role in saving them, too.
Shopping used to be stimulating. Although its end was sales, its means was a mix of status and spectacle. It was social commerce in which partakers transacted not just cash, but also cachet.
Nowhere was this more evident than in the earliest department stores, whose architects designed them to be destinations. In London, for instance, Harrods boasts the motto “Omnia, Omnibus, Ubique”—Latin for “All Things for All People, Everywhere.” Established in 1849, it has seven floors, comprising more than 1 million square feet across more than 330 departments. The store installed one of the world’s first escalators in 1898, opened a world-famous food hall in 1902, and sold exotic pets such as lion cubs until the 1970s.
In recent decades, China has undergone the most dramatic urban migration in the history of the world, so you might be forgiven for thinking all that is required from urban planners is to "build it and they will come," so to speak. However, as the Western media often reports with much schadenfreude, China's unprecedented urban explosion has not come without a few missteps, and many new cities are widely claimed to be "ghost cities," empty of residents even as more gigantic apartment blocks are being built. Such stories are usually accompanied by anecdotes of empty public spaces and a rough count of the number of homes left in the dark at night, but little further empirical data. So exactly how underpopulated does a city have to be to be a "ghost city," and just how rife are such places in China?
As reported by MIT Technology Review, one Chinese web company has started looking for answers to just such questions. Baidu, effectively a Chinese version of Google, has used their "Big Data Lab" to investigate the commuting patterns of their 700 million users, establishing exactly which cities are dramatically underpopulated.


")
")
")
")


 and the flagship Milan office was informed by a new tool called space-utilization technology. Using data points collected over 180 days through Wi-Fi, Microsoft can now analyze how people use its office spaces. Image © Hufton + Crow")


.jpg?1448462729 "Owen Launch by Tacklebox Architecture. Image © Juliana Sohn for OWEN")


