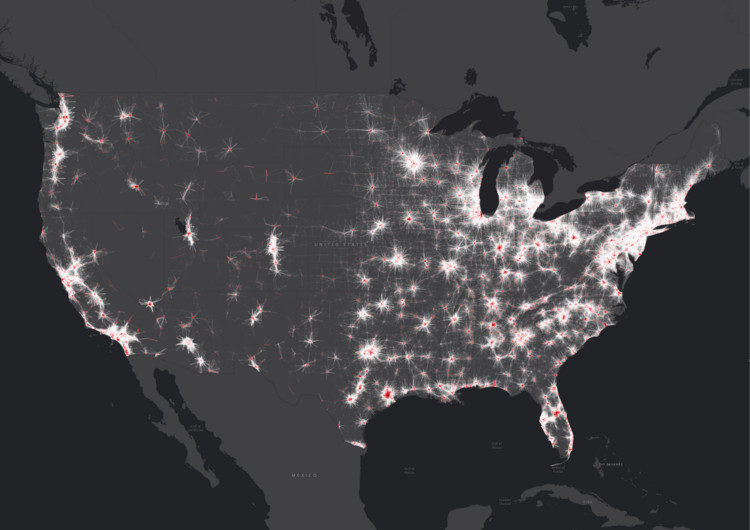
Intro GPS systems and Location Based Services give access to an important amount of data that is currently being used mostly for traffic analysis - but which, if properly processed, could open up infinite possibilities for planning.The access to these Mobility Big Data is no longer a privilege of large cities; on the contrary, it is possible to effectively apply the technologies to increasingly more diverse territories, from mega-regions to contained districts and cities. These data, when retrospectively compared to previously collected ones, lend themselves to multiple applications loosely related to the traffic issue, such as socio-demographic or economical studies. Systematica opens the doors of its laboratory to show us what are the potentials and limits of these tools, starting from a direct experience - a research project, developed in the Los Angeles area.
For the 2019 Shenzhen Biennale of Urbanism\Architecture (UABB), titled "Urban Interactions," (21 December 2019-8 March 2020) ArchDaily is working with the curators of the "Eyes of the City" section to stimulate a discussion on how new technologies might impact architecture and urban life. The contribution below is part of a series of scientific essays selected through the “Eyes of the City” call for papers, launched in preparation of the exhibitions: international scholars were asked to send their reflection in reaction to the statement by the curators Carlo Ratti Associati, Politecnico di Torino and SCUT, which you can read here.
In transportation planning, manual/automatic traffic counts and household/ personal travel surveys were historically conducted to collect travel behavior data. Today, available mobility data has created disruptive changes to this approach, placing the transport planner in a more proactive role and providing a set of analytical tools for any venture investor, city decision, or other planning experts seeking to improve urban mobility.
Big Data for transportation is collected as anonymous and accurate location data from mainly two sources: Location Based Services (LBS) from applications installed on mobile devices and from navigation GPS systems in vehicles. Through complex algorithms, the data is processed and converted in mobility analytics metrics that can provide powerful insights on travel patterns, such as origin-destination matrices, trip length, travel speed, trip purpose, trip duration and socio-economics.
In this paper we present the way Big Data was used on a research project on US cities in general with a specific focus on the city of Torrance in Los Angeles. The paper is focused on highlighting the influence and contribution of the Big Data to understanding cities, their current features and their possible evolution based on the empirical evidence collected through Big Data, paving ultimately the road to achieving both innovative and sustainable transport planning solutions. Big Data is effective on every scale: from the wide mega-region scale to district and corridor studies. Beyond the huge benefits of Big Data, we also learnt about the current limits of the available data and the potentials for improvement that they embed within, especially in relation to traffic modelling tools.
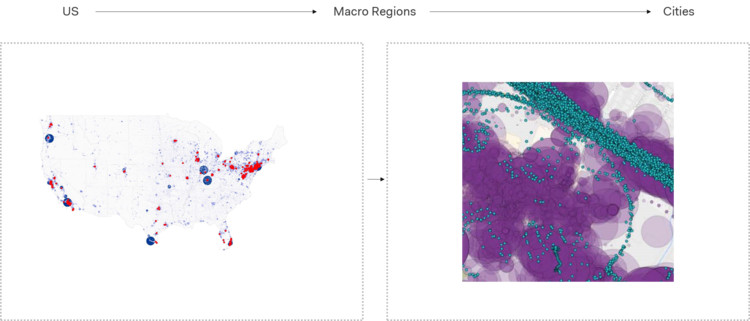
Macro Scale: Learning about cities’ structure and specificities through observing Big Data
USA is one of the biggest “test beds” for Big Data with the richest dataset worldwide – not only in terms of the amount of data available, but also in terms of the granularity of information and the possible correlations that can be found between open source socio-economic census data and movement patterns extracted from Big Data.
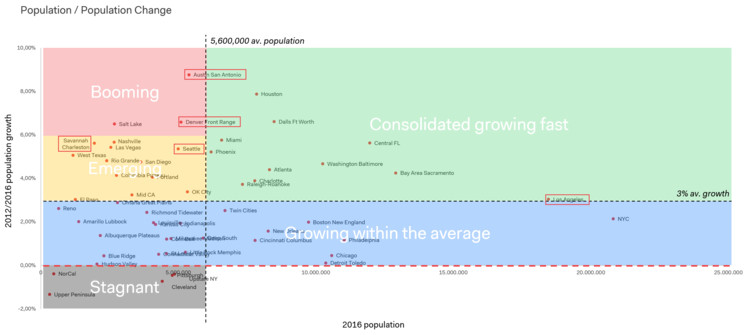
The research project on US cities had the objective to provide a full understanding of the future of mobility in major urban agglomerations. The in-depth and full-fledged research on major US Cities and Regions assisted us in analysing current mobility patterns, travel behaviours and service offerings, with the ultimate aim to transform this knowledge into evidence for constructing scenarios of how mobility trends can evolve in the near future. Comparison in trait changes within the last 10-years census data allowed us to identify areas with the fastest growth in terms of socio-demographics, geographic and travel behaviour changes, differentiating between the booming regions, the emerging regions and the consolidated fast-growing regions.
This shed light on the capability of Big Data to providing a clear understanding of cities and megaregions not only in their static conditions, size and scale, but also in their everchanging traits that characterize their responsiveness to changing habits and mobility patterns.
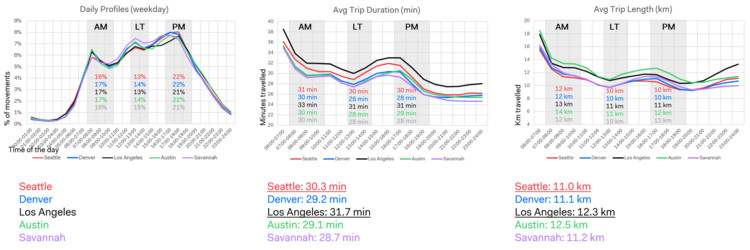
One important finding that emerged from looking at cities with totally different structures is their similar mobility profiles, peak hours, travel times, and trip lengths. Despite their similarities (as shown in the profiles below) the differences are already indicative of what might be described as the cities’ “mobility DNA”. Average travel time and distances travelled in Savannah, for instance, are lower than those in Los Angeles. Similarly, Lunchtime peaks in Savannah are sharper than Los Angeles while the opposite is true for morning and evening peaks, as a result of heavy commuting movements.
Further investigations were carried out to understand further the shape of the cities, starting from the areas that are affected by daily movements. To this end, movement densities (number of trips/ surface area) of specific areas within the city were compared to the average city movement density. This also showed significant differences between cities: while Austin’s movements are heavily concentrated in downtown (22 times the average movement density), downtown movements in Los Angeles are only 6 times the average movement density, revealing the high but well-distributed movement density of Los Angeles that is spread on a largely urbanized area.
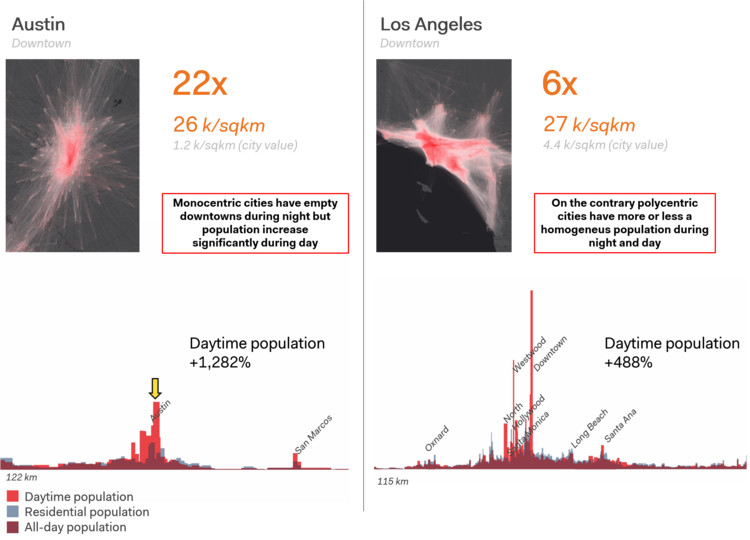
One more indicator that Big Data gave was the significant change in population between day and night time, giving interesting insights on travel patterns and daytime population –occurring mostly in downtown areas. All the selected areas in Austin and Los Angeles presented changes in population between daytime (workers, visitors and some residents) and night time (residents), revealing Los Angeles’ robust multipolar structure compared to Austin’s that to date suffer from strong polarities between center and periphery. Daytime population can also be directly correlated with travel demand patterns and needs, providing basic information on how to plan transit networks that accommodate the expected growth and mobility patterns changes.
One last indicator that was examined is the change in mobility pattern intensities between weekdays and weekends. This was used to learn more about commuting between the city center and periphery, city users’ commuting travel distances, the city sprawl and the degrees of independency and interdependency among different parts of the city.

Micro Scale: the case of Torrance – Planning starting from Big Data
Narrowing down the analysis to the city scale leads to a more precise and detailed understanding of how mobility patterns are influenced by the land use and the city characteristics. The research project conducted on the city of Torrance (CA), in the outskirts of Los Angeles, was the perfect reference to use transportation Big Data to unveil the hidden potentials of a low-density urban environment and to identify solutions and pilot projects to improve the current urban conditions in the city.
Traditionally, collected traffic data provides information mainly on peak hours that roughly represent 20-30% of the daily movements and on traffic flows on major streets only. With Big Data it is unprecedently possible to monitor flows for longer and continuous durations and observe the comprehensive functioning of each part of the city, focusing hence on all times of the day, including the remaining 70% of daily non-commuting movements that occur outside the morning and evening peak intervals.
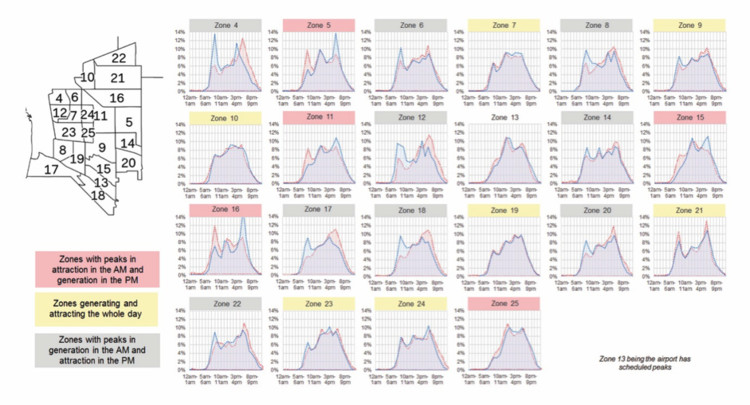
Big Data is extracted from Traffic Analysis Zones (TAZs) that can be drawn and defined according to the planners' needs and interests, disregarding the census block sizes and or any predefined city segmentation units and zones. Each city portion has its own “identity” – so to speak – characterized by its very specific mobility profile, comprising of inbound and outbound traffic movements as a result of its land use, land use mix, prevailing functions, anchor functions, etc. As shown in the example below, carrying out this exercise on 25 different city zones with different mobility profiles, zones are automatically grouped into categories based on their profile distinguished by different traits: sharp morning and evening peaks that represent either residential or office monofunctional land use versus flatter patterns which mobility intensity builds up and decays gradually during the day in areas dominated by retail and fully-mixed use functions.
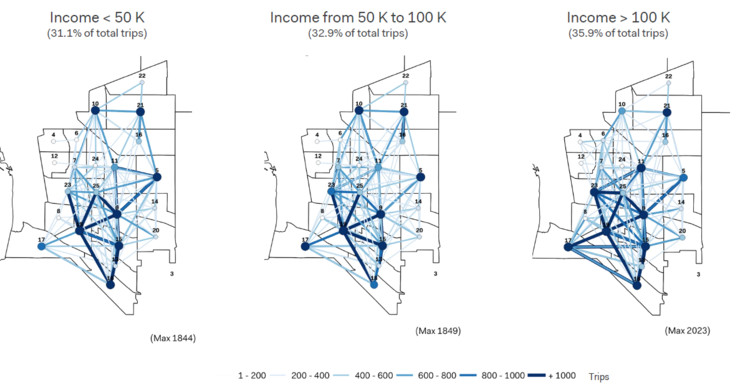
The correlation between origin and destination zones and their specific socio-economic characteristics provide a very rich corpse of information that characterizes every movement and relationship between any Origin-Destination zones pair, such as average household size, household income, car ownership, family with or without children, employment status, etc. The example below shows the different O-D relationships during a day segmented according to the income levels. At a first glance, this type of information might seem irrelevant to a planner however as we think further about the relationship between users’ willingness to pay and their income levels and the degree to which this might impact their proneness to shift modes, this type of information becomes essential in reading the city’s geography with specific attention to its users’ financial conditions. It is also noteworthy that all the shown trips are mainly carried out by car, hence developing alternative transit options for all short distance movements and for lower income tiers would ensure a higher chance of success of collective modes of transportation.
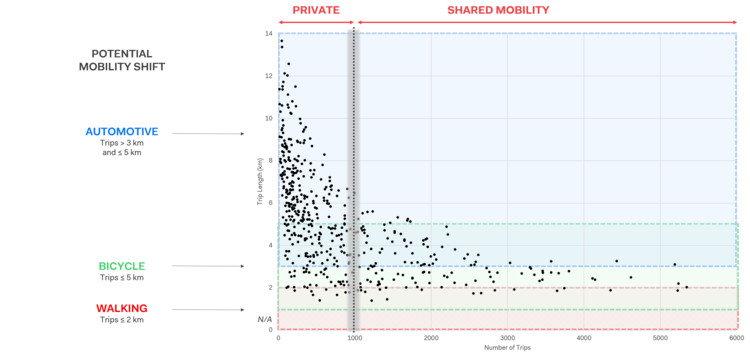
One of the main challenges in Big Data is how to transform this immense body of evidence into a planning tool, hence moving the analytical level from the reading mode to the writing (planning in this case) mode. In order to do so, we had to dissect further all Origin-Destination pairs and position them according to two main scales: travel distance (measured in km) and number of trips. By doing so, all 225 O-D pairs were presenting different values based on the two above parameters – see graph below. Two main conclusions were extracted: The first is that each group of O-D movements that belongs to common travel distance can be associated to a potential shift to a specific mode of transport – 0-2km can be shifted to on foot movements; 1-5km can be shifted to bike movements; 3km and above can be shifted to Public Transportation and shared vehicles. Similarly, the second conclusion is that each group of O-D movements with a similar number of trips can be associated to a potential shift from private/ individually shared (on-demand services) to public/ collectively shared modes of transport as the larger number of trips may economically justify an investment in collective modes of transportation. This simple reading allowed us to focus interventions on different modes of transit based on the identified O-D pairs and their characteristics.
The Torrance mobility insights, presented above, identified a series of potentials for private stakeholders to provide solutions and solidify a partnership with the City, shaping the Torrance Living Lab initiatives that were aimed to reduce the gaps between different communities and improve the quality of life within Torrance and neighbouring communities. The objectives were aimed to be achieved through pilot projects, that provide a concrete response manifested into mobility devices, transport infrastructure, mobility information or service offerings. Different pilot projects were responding distinctly to either city needs or people’s needs (or both) addressing the population segments based on their specific mobility requirements (senior, commuter, family, retail customer, etc.)
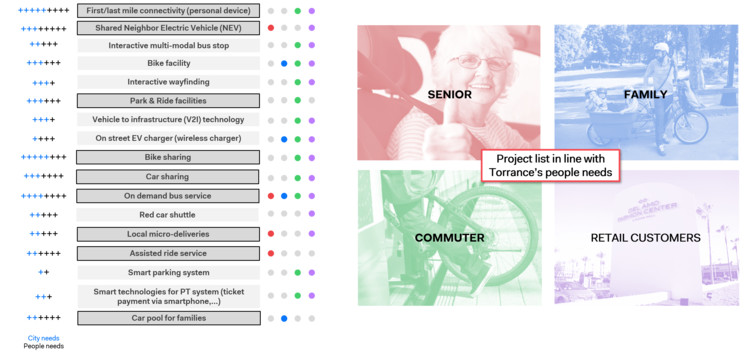
More specifically, several pilot projects were developed more in detail, identifying their exact location and influence area. For example, a specific area of the city was identified for a major retrofitting project to promote active transit modes. The zone with the highest number of internal short-distance trips was selected as the optimal area for a pedestrian pilot project as said movements represent 12% of the overall trips. Surprisingly, the area is not in the Old Town of Torrance but rather in a low-density area that currently lacks a clear urban identity, with the exception of its main street (Sepulveda Boulevard) where the mixed-use offers potential for a more interactive pedestrian experience. The current status of the street however does not encourage walkability and therefore there was ample space for improvement.
The pilot project seeks to increase the number of pedestrian crossings while also placing an emphasis on last mile connectivity. Neighbourhood bus routes are often concentrated on the main road, therefore leaving secondary roads, like Sepulveda Boulevard, without adequate connectivity services. By introducing last mile connections, the street becomes more interactive with its surroundings and acts, not only as an efficient throughway, but also as a neighbourhood enhancement for the high pedestrian traffic that real time data confirmed.
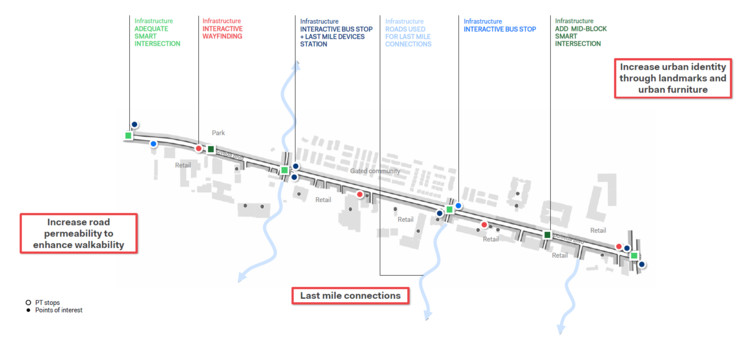
In addition to a specific pedestrian pilot project within one zone in Torrance, a proposal for an efficient implementation of a bike share program was brought forward and a feasibly public transit expansion to better serve the city as a whole through on-demand shuttle services with route alignments that were planned according to the previously shown O-D patterns.
Conclusion: Lessons learnt and ample room for improvement
While travel data is currently mainly used for various ridership analyses, the huge potential to employ it for simulation-based planning remained untapped so far. Traditional traffic models are conventionally based on travel diary surveys and population census, which cover only a small sample of the actual population (about 2%). With the availability of Big Data, the sample size significantly increases; depending on the study area, it can reach up to 35%.
Besides, the Big Data can be used to improve the accuracy of the models, integrating and enhancing their capabilities of representing human behaviour, especially when moving from trip-based models to activity-based models, where precise information about the trip and the activities chain is crucial, or on a local scale when considering more detailed agent-based models.
The different types of data are complementary; the mobile devices and Smart Card Automatic Fare Collection (SC-AFC) systems have a large amount of individual-based data; GPS indicates the general behaviour of people and their willingness to move, providing information about travel time, frequency, distances and speed; Point of Interests (POIs) data can inform traffic models about characteristics of urban space and type of activity, highlighting visiting time and time spent. Although the amount of the available data is a great asset, the main challenge regards the number of different data sources which do not allow for an integrated and unique approach to process the data.
Future research must focus on aggregating Big Data information from different sources into a single database, which can have a huge potential for information to feed traffic models and to allow practitioners and planners to provide an accurate understanding of mobility behaviour, people's preferences and forecasting.
Another important fact that any planner should bear in mind is the potential bias and representativeness of the data if not accurately contextualized with the population generating the data. For well-defined challenges where many variables and their inter-relationships are understood, small, carefully stratified and representatively sampled data may be more effective at finding solutions than the use of a large amount of Big Data.
The Big data is revolutionizing the approach to transport planning in an unprecedented way, supporting democratization of data that allows even small cities to have access to mobility metrics to prioritize the best tactics and actions to transform auto-oriented networks.
The access to archival data from different time periods gives powerful tools to assess almost instantaneously the impact of implemented measures on the people's mobility patterns. This immediate validation defies the historically static approach to transport planning, which traditionally utilized case studies and manuals to forecast outcomes. Rather than planning, implementing, operating, testing, and validating at the end – real time data allows for the validation of projects to occur throughout the design process, turning a linear model of urban planning into a cyclical system of data extraction and adaptation over time.
It is our job, as planners, engineers, and architects to take advantage of the potential that real time Big Data provides in order to create a more adaptable and resilient urban framework that has the ability to serve the needs of all of its citizens at all times.
About the Authors:

Rawad Choubassi currently acts as a Director and Board member of Systematica where he leads planning and research projects on mobility in urban environments and complex buildings focused on urban regeneration and new development transport planning, feasibility and due diligence, parking engineering and pedestrian flow analysis.
Choubassi has gained previous experience, through intensive work on large-scale projects with Arata Isozaki (Tokyo), Kliment-Halsband Architects (New York) and others. He leads a team of multi-disciplinary consultants for expanding the limits of the science behind mobility engineering on every scale. His linguistic skills have facilitated communication and understanding of different regulations and cultures.

Alessandro Vacca is a transport engineer working with Systematica since 2010. He is Senior Consultant and Project Manager and has a broad knowledge of transportation planning and policy assessment and appraisal, stemming from involvement in a wide variety of transport and mobility-related projects.
Alessandro Vacca is specialized in transport modelling and master planning, including the development of comprehensive transport demand models with sound understanding of travel demand behavior statistics, supported by the knowledge of various software packages. He is also experienced in traffic and parking assessment, micro-simulation and pedestrian mobility, through his involvement in several projects around the world.

Tiffanie Yamashita is an urban engineer with experience in urban design and transport planning. Since 2013, she has been collaborating with Systematica in a number of international projects. She worked on various projects at different scales and phases from high-rise buildings to urban master plan and national transport planning.
She fulfills her role as a transport consultant, mainly in supporting complex urban projects and processing strategies and solutions for mobility issues. Her skills are mainly technical and design analysis of existing and planned urban context for transportation-related projects, assessment of vehicular and pedestrian traffic flow and definition of design solutions.

Marianna Zuretti is an urban and transport planner. She has been working with Systematica since 2015. Her work is mainly focused on urban studies and transport planning at multiple scales and in diverse and international contexts: Europe, Middle East and USA.
Marianna Zuretti is constantly involved in transport planning for urban and development regeneration projects, strategic advisory, traffic analysis and management, with a focus on pedestrian mobility. She also works on transport modelling, using tools and simulation platforms to support strategic decisions to explore and identify the most suitable planning solutions in every context and at any scale.
"Urban Interactions": Bi-City Biennale of Urbanism\Architecture (Shenzhen) - 8th edition. Shenzhen, China
http://www.szhkbiennale.org.cn/
Opening in December, 2019 in Shenzhen, China, "Urban Interactions" is the 8th edition of the Bi-City Biennale of Urbanism\Architecture (UABB). The exhibition consists of two sections, namely “Eyes of the City” and “Ascending City”, which will explore the evolving relationship between urban space and technological innovation from different perspectives. The “Eyes of the City" section features MIT professor and architect Carlo Ratti as Chief Curator and Politecnico di Torino-South China University of Technology as Academic Curator. The "Ascending City" section features Chinese academician Meng Jianmin and Italian art critic Fabio Cavallucci as Chief Curators.
"Eyes of The City" section
Chief Curator: Carlo Ratti.
Academic Curator: South China-Torino Lab (Politecnico di Torino - Michele Bonino; South China University of Technology - Sun Yimin)
Executive Curators: Daniele Belleri [CRA], Edoardo Bruno, Xu Haohao
Curator of the GBA Academy: Politecnico di Milano (Adalberto Del Bo)
"Ascending City" section
Chief Curators: Meng Jianmin, Fabio Cavallucci
Co-Curator: Science and Human Imagination Center of Southern University of Science and Technology (Wu Yan)
Executive Curators: Chen Qiufan, Manuela Lietti, Wang Kuan, Zhang Li


