1. ArchDaily
  2. Data Mapping

Data Mapping: The Latest Architecture and News

"Datament": The Polish Pavilion at the Venice Biennale 2023 Examines Humanity's Relationship with Data

The Polish pavilion will present Datament at the International Architecture Exhibition – La Biennale di Venezia. The installation will allow visitors to experience data in its physical form. The core aim of the exhibition is to showcase how prevalent data has become, shaping the reality in which we live, create, and dwell. Created by Anna Barlik, Marcin Strzała and Jacek Sosnowski, Datament is the starting point for discussing how data and new technologies will play a crucial role in the future.

Crafting an Intersectional Gaze on Cities, and Three Other Reasons Why Urban Planning Needs Data Feminism

Data Feminism, as conceptualized by D’Ignazio & Klein (2020), introduces intersectional feminism in data science and invites us to examine power relations and dynamics of oppression that are built into data infrastructures that underpin society today.

Big Data and Urbanism: How to Organize Information for Optimal Application

Big Data refers to data that, due to its quantity and complexity, requires specific applications in order to be processed. New trends in urbanism, data collection, and management, not to mention the development of new platforms and tools, have given rise to a new era in urban analysis, creating new resources to understand, evaluate, and manage the evolution of cities.

This Online Tool Generates High-Quality Geographic Maps of Data in Seconds

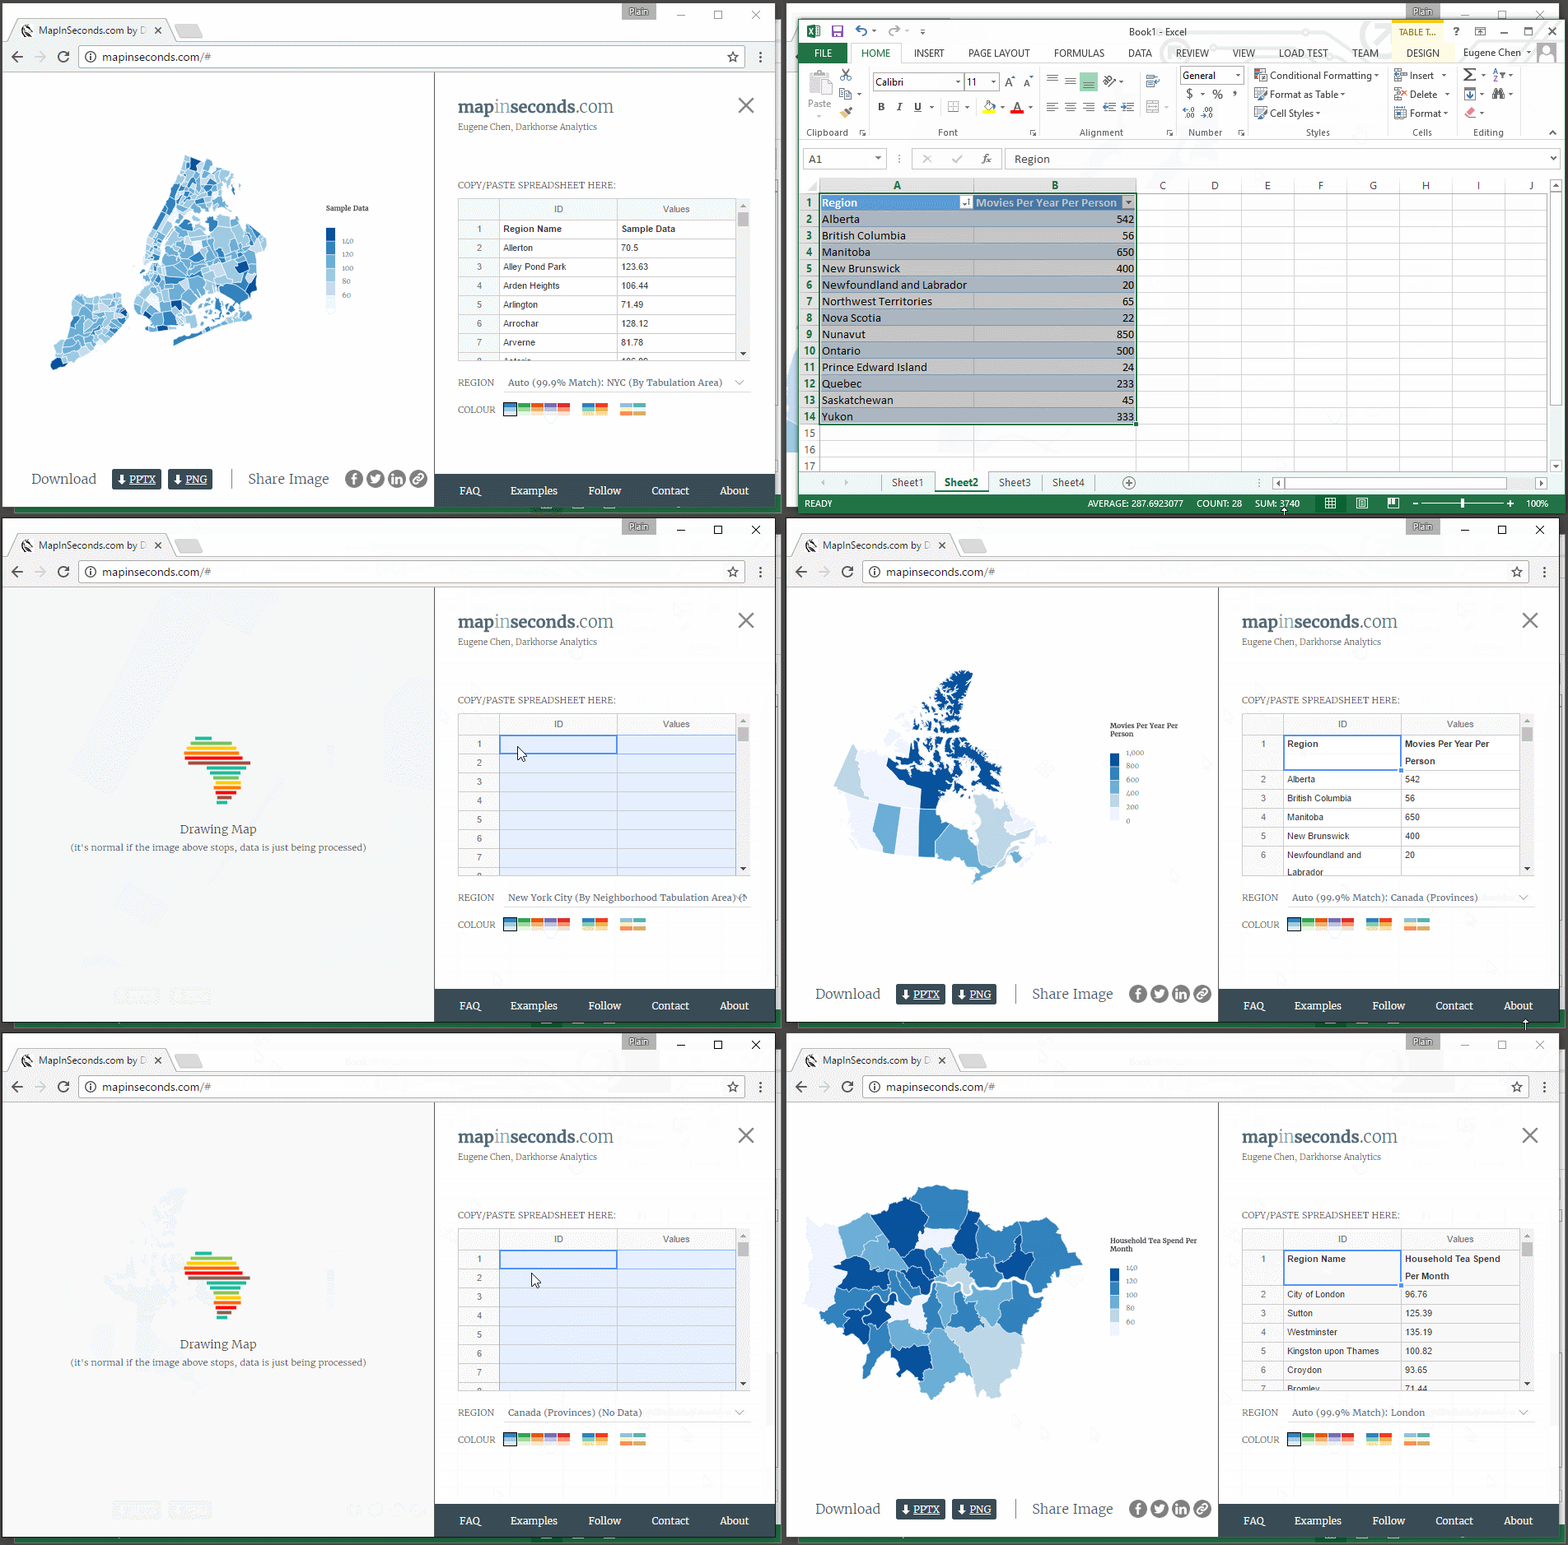
Have you ever had to create a map for your project, thinking you could get it done within 30 minutes, but then spent an entire afternoon on it? Between collecting data, creating a base map, choosing a color scheme, and finally putting together a graphic, creating a map can be a long, trying process, taking up precious time when you could be doing other work. Map-making shouldn’t be this way.

Created by Darkhorse Analytics, mapinseconds.com is a free online productivity tool which generates clear, quality maps based off of your data. Here’s how it works: collect and organize your data into two columns on either an Excel or Google spreadsheet, open mapinseconds.com, paste your data into the application’s spreadsheet, and voila! Your custom map is finished!

Social Maps Could Potentially Shape Future City Planning

What is a city? To technologist Dave Troy, a “city is the sum of the relationships of the people that live there.” By mapping the interests of dwellers in some of the world’s most populated cities by looking at what they share online, Troy has generated a new and incredibly detailed way to view a city’s diversity beyond race. This rich data, as Troy believes, provides a real opportunity to design cities that are truly desired.

Software Engineers Map All the Buildings in the Netherlands

The Waag Society, together with designer and software engineer Bert Spaan, have put the Netherlands back on the map - the data map. After several months of coding and design, the partnership has managed to account for all 9,866,539 buildings in the country, visualized in varying colors to identify old and new buildings. After a user clicks on a specific block, additional building and city information displays square footages, addresses, populations and programs, among other stats. Users can navigate from Amsterdam to the Hague experiencing hundreds of years of urban development along the way, from the pre-1800s to post-2005 buildings, indicated by the red to blue gradient.