1. ArchDaily
  2. Architecture Billings Index

Architecture Billings Index: The Latest Architecture and News

November ABI Continues to Drop

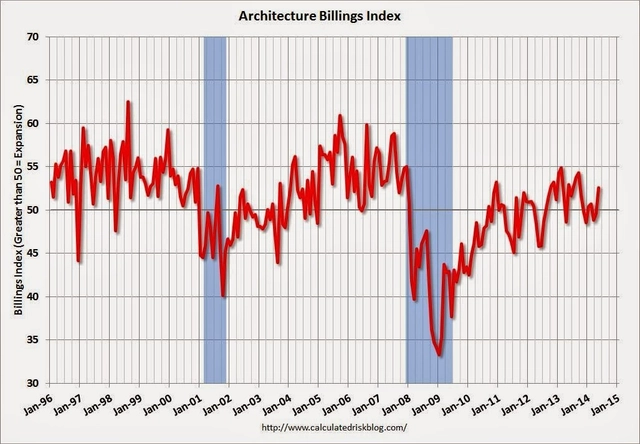
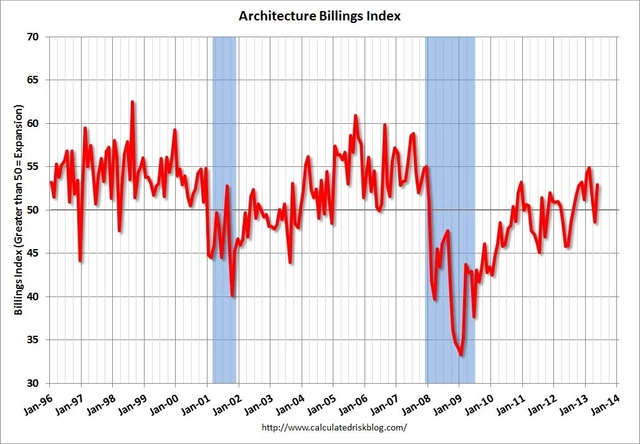
While the US Architecture Billing Index (ABI) has remained positive for seven consecutive months, the score continues to slowly drop and is now teetering on the edge of falling into the red. As the American Institute of Architects (AIA) says, any score above 50 reflects an increase in design services. However, November's ABI score was 50.9, down from the mark of 53.7 in October, revealing a drop in demand. The new projects inquiry index was 58.8, following a mark of 62.7 the previous month.

“Demand for design services has slowed somewhat from the torrid pace of the summer, but all project sectors are seeing at least modest growth,” said AIA Chief Economist Kermit Baker, Hon. AIA, PhD. “Architecture firms are expecting solid mid-single digit gains in revenue for 2014, but heading into 2015, they are concerned with finding quality contractors for projects, coping with volatile construction materials costs and with finding qualified architecture staff for their firms.”

A breakdown of regional highlights, after the break.

October ABI Reveals Decrease in Demand for Design Services

Demand for design services in the US has slowed. According to the latest Architecture Billings Index (ABI) reported by the American Institute of Architects (AIA), the October ABI score was 53.7, down from a mark of 55.2 in September, and the new projects inquiry index fell to 62.7. Despite this, the demand is still considered “healthy” with the South showing the strongest regional conditions.

“Though it has been slow in emerging, we’re finally seeing some momentum develop in design activity for nonprofits and municipal governments, and as such we’re seeing a new round of activity in the institutional sector,” said AIA Chief Economist Kermit Baker, Hon. AIA, PhD. “It will be interesting to see if and how the results of the mid-term Congressional and gubernatorial elections impact this developing momentum.”

A breakdown of regional highlights, after the break.

August ABI Remains Strong

Demand for design services in the US continue to increase, as momentum from July’s highest recorded strength since 2007 continues. The American Institute of Architects reported the August Architecture Billings Index (ABI) at 53.0, down from July’s mark of 55.8, and the new projects inquiry at 62.6.

“One of the key triggers for accelerating growth at architecture firms is that long-stalled construction projects are starting to come back to life in many areas across the country,” said AIA Chief Economist Kermit Baker, Hon. AIA, PhD. “Long awaited access to credit from lending institutions and an increasing comfort level in the overall economy has helped revitalize the commercial real estate sector in recent months. Additionally, though, a crucial component to a broader industry-wide recovery is the emerging demand for new projects such as education facilities, government buildings and, in some cases, hospitals.”

A breakdown of regional highlights, after the break…

May ABI Shows Return to Growth in US Market

The US Architecture Billings Index showed a significant improvement in May, jumping to a score of 52.6 and showing some growth after two consecutive months of contraction. As the American Institute of Architects (AIA) reports, its two new measures of growth also showed positive results: the Project Inquiries Index rose to 63.2; and the Design Contracts Index - despite dropping slightly from last month's 54.6 - still showed growth at 52.5 points.

"Volatility continues to be the watchword in the design and construction markets, with firms in some regions of the country, and serving some sectors of the industry, reporting strong growth, while others are indicating continued weakness," said AIA Chief Economist Kermit Baker, Hon. AIA, PhD. "However, overall, it appears that activity has recovered from the winter slump, and design professions should see more positive than negative numbers in the coming months."

A breakdown of regional and sector highlights, after the break

April ABI Reflects Continued Decrease in Design Services

For the last two months, the U.S. Architecture Billings Index has remained in negative territory. Although the ABI rose slightly from the previous month’s 48.8 mark to 49.6 in April, the score still reflects a decrease in design services. As the American Institute of Architects (AIA) reports, the new projects inquiry index also revealed a slight increase, rising from 57.9 to 59.1.

“Despite an easing in demand for architecture services over the last couple of months, there is a pervading sense of optimism that business conditions are poised to improve as the year moves on,” said AIA Chief Economist Kermit Baker, Hon. AIA, PhD. “With a healthy figure for design contracts this should translate into improved billings in the near future.”

A breakdown of regional highlights, after the break…

U.S. ABI Declines Sharply in March

It seems the U.S. Architecture Billings Index (ABI) has yet to recover from 2013’s end of the year decline. Though 2014 started with a “modest uptick,” the March ABI has reveals a share decrease in design services. As reported by the American Institute of Architects (AIA), the March ABI score was 48.8, down from a mark of 50.7 in February. Despite this, the new projects inquiry index was 57.9, up from the reading of 56.8 the previous month.

“This protracted softening in demand for design services is a bit of a surprise given the overall strength of the market the last year and a half,” said AIA Chief Economist Kermit Baker, Hon. AIA, PhD. “Hopefully, some of this can be attributed to severe weather conditions over this past winter. We will have a better sense if there is a reason for more serious concern over the next couple of months.”

A breakdown of regional highlights, after the break...

February ABI Reveals Slight Improvement

After starting the year with a “modest uptick” that disrupted a three month cycle of decline, the Architecture Billings Index (ABI) for Feburary has revealed that design services in the United States are continuing to (slowly) improve. As reported by the American Institute of Architects (AIA), last month’s ABI score was 50.7, up slightly from a mark of 50.4 in January. In contrast, the new projects inquiry index continued to fall, dwindling from 58.5 to 56.8 in February. This however, as AIA Chief Economist Kermit Baker believes, could be due to harsh weather conditions that stalled construction activity throughout many parts of the country over the past few months .

More information and regional highlights, after the break... 

January ABI Reports "Modest Uptick"

Business in the United States has started the New Year on a more positive note, as January’s Architecture Billings Index (ABI) revealed the first increase in design services after three consecutive months of decline. As reported by the American Institute for Architects (AIA), the January numbers rose from December’s score of 48.5 to 50.4, indicating an increase in billings. However, the new projects inquiry index was 58.5, down a bit from the reading of 59.2 the previous month.

“There is enough optimism in the marketplace that business conditions should return to steady growth as the year progresses,” said AIA Chief Economist Kermit Baker, Hon. AIA, PhD.

November ABI Reflects Slight Contraction in Construction

Despite six months of steady increase, the Architecture Billings Index (ABI) for November revealed a slight decrease in demand for design services. The November ABI score was 49.8, down from 51.6 in October (any score above 50 indicates an increase in billings). The new projects inquiry index was 57.8, down from 61.5 the previous month.

“This slight dip is likely just a minor, and hopefully temporary, lull in the progress of current design projects,” said AIA Chief Economist Kermit Baker, Hon. AIA, PhD.  “But there is a continued uneasiness in the marketplace as businesses attempt to determine the future direction of demand for commercial, industrial, and institutional buildings.”

More highlights from the November ABI, after the break...

ABI Reports Strong Conditions in US Market

The Architecture Billings Index (ABI) has revealed more acceleration in the growth of design activity nationally. As a leading economic indicator of construction activity, the ABI reflects the approximate nine to twelve month lead time between architecture billings and construction spending. The American Institute of Architects (AIA) reported the August ABI score was 53.8, up from a mark of 52.7 in July. This score reflects an increase in demand for design services (any score above 50 indicates an increase in billings). The new projects inquiry index was 63.0, down from the reading of 66.4 the previous month.

"It is fair to say that the design professions are in a recovery mode,” said AIA Chief Economist, Kermit Baker, PhD, Hon. AIA.  “...but a key component to maintaining this momentum is the ability of businesses to obtain financing for real estate projects, and for a resolution to the federal government budget and debt ceiling impasse.”

Key August ABI highlights:

July's ABI Jumps Full Point, Indicates National Growth

The July Architecture Billings Index (ABI) has jumped to 52.7, up more than one full point from June's 51.6, indicating "acceleration in the growth of design activity nationally." As any score above 50 indicates an increase in billings, July's score reflects an increase in demand for design services; this increase was seen most dramatically in the area of new projects, which jumped from 62.6 in June to 66.7 in July.

Despite the optimistic results, AIA Chief Economist, Kermit Baker, noted the uneven nature of the growth, and warned that "it is premature to declare the entire sector has entered an expansion phase.”

More statistics from July's ABI, after the break...

June’s ABI Reflects Consistent Industry Growth

The Architecture Billings Index (ABI) remained positive again in June after the first decline in ten months in April. As a leading economic indicator of construction activity, the ABI reflects the approximate nine to twelve month lag time between architecture billings and construction spending. The American Institute of Architects (AIA) reported the June ABI score was 51.6, down from a mark of 52.9 in May. This score reflects an increase in demand for design services (any score above 50 indicates an increase in billings). The new projects inquiry index was 62.6, up sharply from the reading of 59.1 the previous month.

Key ABI highlights and details on the construction industries remaining threats after the break...

ABI Bounces Back in May

Following the first negative downturn in ten months (what AIA Chief Economist, Kermit Baker, Phd, is hoping was just a "blip"), May's Architecture Billing Index (ABI) has bounced back from a score of 48.6 to 52.9. Any score above 50 indicates an increase in billings (aka an expansion in demand for architects' services).

Baker notes that "there is [still] a resounding sense of uncertainty in the marketplace from clients to investors and an overall lack of confidence in the general economy – that is continuing to act as a governor on the business development engine for architecture firms.” However, the scores, which revealed the most growth in the Northeast as well as in the multi-family residential and institutional sectors, are good signs for the design and construction industries. 

More results of this month's ABI, after the break...

Positive Signs of Growth Reflected in Steady ABI and Higher Intern Employment Rates

For the eight consecutive month, the Architecture Billings Index (ABI) is reflecting a steady upturn in design activity. As a leading economic indicator of construction activity, the ABI reflects the approximate nine to twelve month lag time between architecture billings and construction spending. Although the American Institute of Architects (AIA) reported the March ABI score was 51.9, down from a mark of 54.9 in February, this score still reflects an increase in demand for design services (any score above 50 indicates an increase in billings). In addition, the new projects inquiry index was 60.1, down from the reading of 64.8 the previous month.

“Business conditions in the construction industry have generally been improving over the last several months,” said AIA Chief Economist, Kermit Baker, PhD, Hon. AIA. “But as we have continued to report, the recovery has been uneven across the major construction sectors so it’s not a big surprise that there was some easing in the pace of growth in March compared to previous months.”

Key ABI highlights and details indicating higher employment rates for intern architects after the break...

ABI Continues to Steadily Climb for Seventh Straight Month

ABI Continues to Steadily Climb for Seventh Straight Month - Featured Image
via Calculated Risk

An increasing demand for design services in the United States continues to strengthen the Architecture Billings Index (ABI). As a leading economic indicator of construction activity, the ABI reflects the approximate nine to twelve month lag time between architecture billings and construction spending. The American Institute of Architects (AIA) has reported the February ABI score as 54.9, up slightly from a mark of 54.2 in January. This score reflects a strong increase in demand for design services (any score above 50 indicates an increase in billings). In addition, the new projects inquiry index was 64.8, higher than the reading of 63.2 the previous month and its highest mark since January 2007.

“Conditions have been strengthening in all regions and construction sectors for the last several months,” said AIA Chief Economist, Kermit Baker, PhD, Hon. AIA.  “Still, we also continue to hear a mix of business conditions in the marketplace as this hesitant recovery continues to unfold.”

Key February ABI highlights:

ABI Reports Strongest Business Conditions Since 2007

ABI Reports Strongest Business Conditions Since 2007 - Featured Image
ABI November 2012 via Calculated Risk

The numbers are in and the American Institute of Architects’ November Architecture Billings Index (ABI) has revealed positive business conditions for all building sectors for the fourth consecutive month.

As a leading economic indicator of construction activity, the ABI reflects the approximate nine to twelve month lag time between architecture billings and construction spending. Understanding this, the AIA is pleased to report that November has reached a five-year high with a score of 53.2, slightly up from 52.8 in October. Since August, the national billings index has continued to increased above 50.0 – the break-even point between contraction and growth – reflecting a steady rise in demand for design services. The West seems to be the only region in contraction, coming in at a score of 49.6.

Additionally, November also sees the Project Inquiry Index at 59.6, marking the 47th straight month in which inquiries into architectural services has been increasing.

“These are the strongest business conditions we have seen since the end of 2007 before the construction market collapse,” said AIA Chief Economist, Kermit Baker, PhD, Hon. AIA. “The real question now is if the federal budget situation gets cleared up which will likely lead to the green lighting of numerous projects currently on hold. If we do end up going off the ‘fiscal cliff’ then we can expect a significant setback for the entire design and construction industry.”

View the ABI highlights in greater detail, after the break…

Update: ABI July

Update: ABI July - Featured Image

In continuing our coverage of the Architecture Billings Index, we share this past month’s score of 48.7 While such a mark still falls in negative territory (any score under 50 indicates a decline in billings), July’s activity was a considerable jump from June’s meager 45.9. And, even better, July’s new projects inquiry index moved up almost two full points to 56.3. Regionally, the South is surprisingly leading the averages with 52.7, followed by the Midwest with 46.7, the West with 45.3, and lastly, the Northeast region capping out at 44.3. In terms of the sector breakdown, multi-family residential remains strong with 51.4 followed by commercial/industrial projects and institutional projects. AIA Chief Economist, Kermit Baker, PhD, Hon. AIA, explained, “Even though architecture firm billings nationally were down again in July, the downturn moderated substantially. As long as overall economic conditions continue to show improvement, modest declines should shift over to growth in design activity over the coming months.”

Update: ABI June

Update: ABI June - Featured Image

The June ABI has proven that we still have not been able to shake the weak activity of May - the score capped out at 45.9 from 45.8, marking the third month in negative territory. The market continues to show a drop in demand across all design services, in all regions. The poor conditions suggest upcoming weakness in spending on nonresidential construction projects, as each sector of construction shows negative growth commercial/industrial 46.9, institutional 46.0, and mixed practice 45.9. “The downturn in design activity that began in April and accelerated in May has continued into June, likely extending the weak market conditions we’ve seen in nonresidential building activity ,” said AIA Chief Economist, Kermit Baker, PhD, Hon. AIA. “While not all firms are experiencing negative conditions, a large share is still coping with a sluggish and erratic marketplace.”