


The levels of air pollution reached by major urban centers around the world in recent years reveal the troubled relationship we have maintained—and continue to maintain—with our environment. The gravity of the issue lies in the fact that this not only affects the overall balance of the planet, but according to the World Health Organization, the current state of the atmosphere also causes, through the simple act of breathing, the death of around seven million people each year. Shortly after governments in various countries announced measures to prevent the spread of the coronavirus—lockdowns and isolation—numerous studies began to show an unexpected and promising trend: air pollution levels in many cities began to drop significantly within days of the measures being announced due to reduced traffic and a decline in industrial emissions.
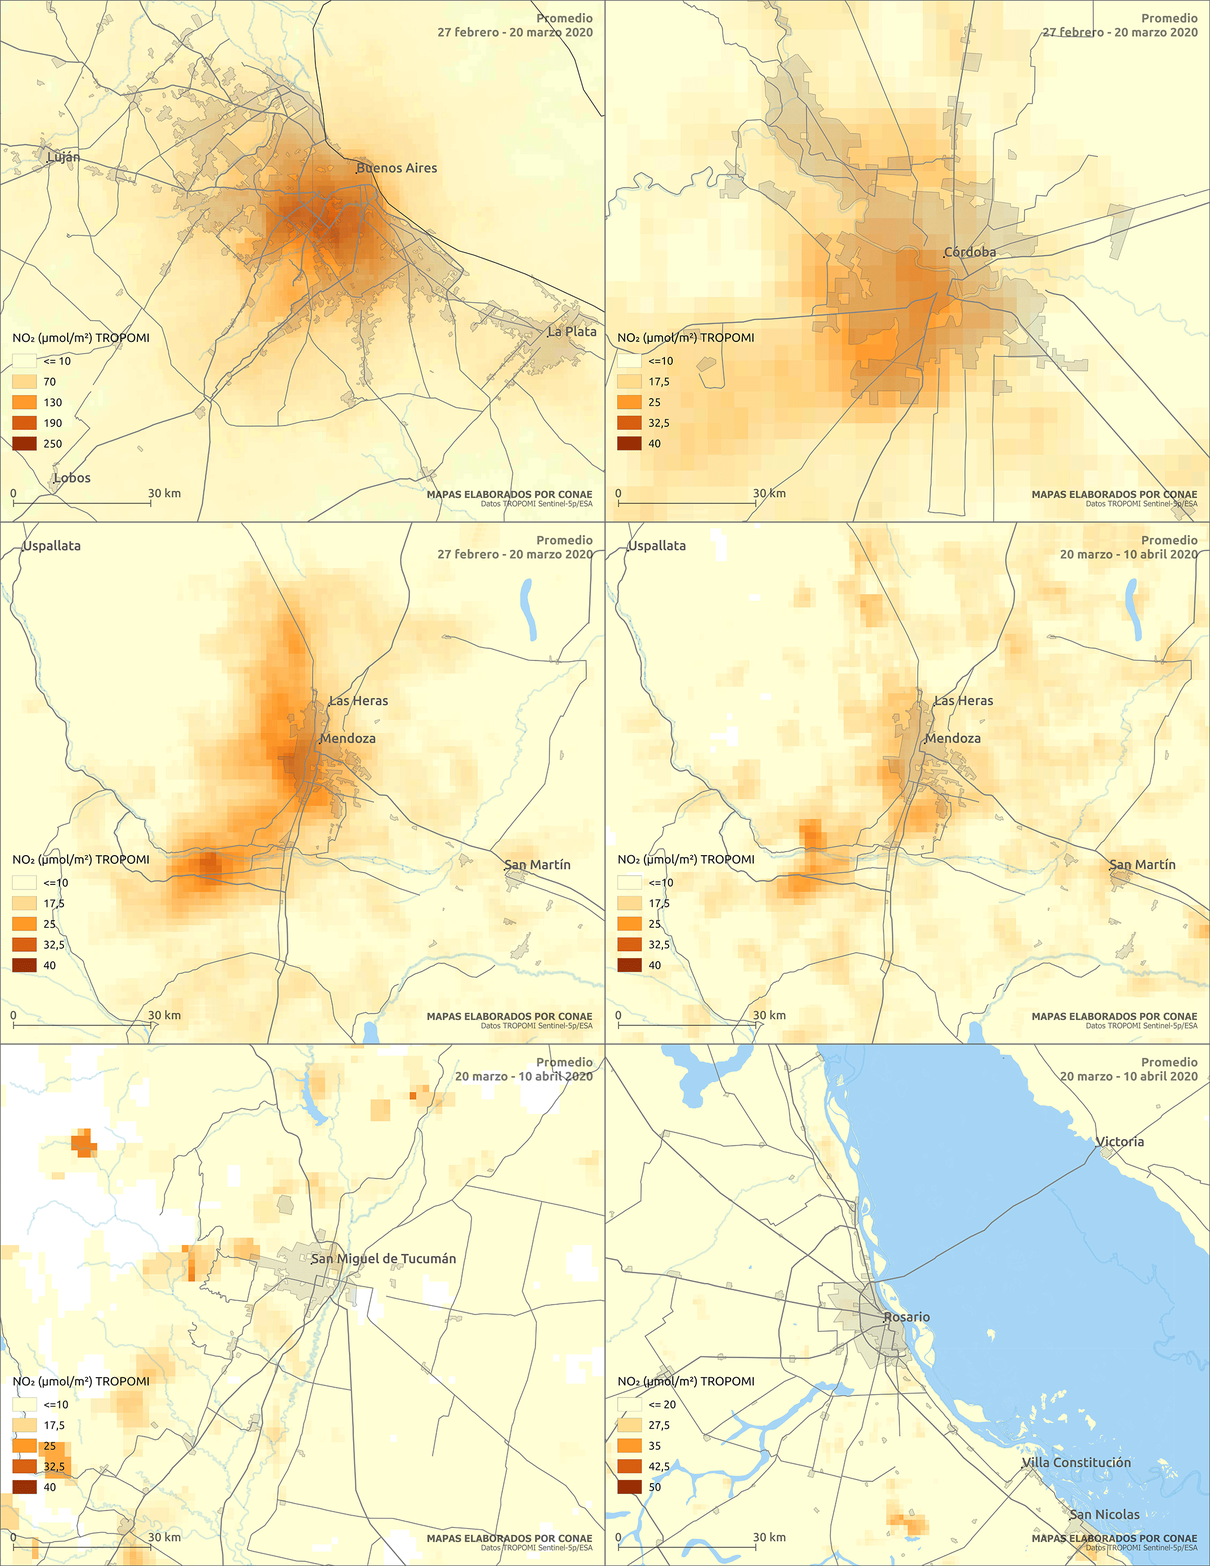
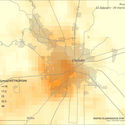
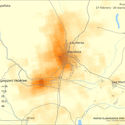
In Argentina, a series of maps developed by the National Space Activities Commission (CONAE) based on satellite imagery—from the Sentinel-5p satellite—clearly show how this phenomenon played out nationwide. Comparing the days following the announcement of the Social, Preventive, and Obligatory Isolation (March 20 - April 10) with the preceding period (February 27 - March 20), a significant decrease in nitrogen dioxide (NO₂) in the atmosphere is evident. The studies were conducted in the country's most populous urban agglomerations, including Buenos Aires, Córdoba, Mendoza, Rosario, and San Miguel de Tucumán:
Buenos Aires

Córdoba

Mendoza

Rosario

Tucumán

While the visual data is clear and, at first glance, we could say that air quality has improved significantly in the country's most populous urban areas, what does this actually mean? If we examine the graphics more closely, several questions arise regarding how they were created and what they mean: Why is nitrogen dioxide chosen for these studies? What is its presence in the atmosphere linked to? Are there other parameters that must be analyzed to determine if air quality has truly improved? How are these parameters expected to change once the quarantine ends? To address these questions, we spoke with María Fernanda García Ferreyra, MSc, an air quality expert at CONAE (National Space Activities Commission) who was the lead researcher responsible for producing these maps. Below, the researcher provides an in-depth look at the maps and how they were created:
When evaluating urban air quality, the pollutants selected for monitoring are the so-called “criteria pollutants.” These are defined by local legislation and international bodies like the World Health Organization. They include nitrogen and sulfur oxides, ammonia, carbon monoxide, ground-level ozone, and particulate matter. There are other chemical species and atmospheric parameters, such as volatile organic compounds, as well as wind speed, humidity, temperature, and rainfall; in short, it is necessary to analyze everything that can influence the presence of criteria pollutants in the air.
There are several methodologies for obtaining this data. On one hand, legislation mandates the use of ground monitoring stations that continuously analyze the air. It is also done remotely using ground-based equipment that measures “at a distance” the interaction of pollutants with light, for example. Satellites also perform remote measurements (orbiting 700 km or more above the ground), analyzing the concentration of these pollutants based on how they absorb or scatter sunlight. While ground measurements provide hourly data, satellites allow for the observation of large regions once a day (or less). They are complementary data sources.
While assessing air quality requires analyzing all criteria pollutants, NO₂ has served in this case as an indicator of the overall picture. Nitrogen dioxide (NO₂) is a pollutant linked to fossil fuel use and biomass burning, which is why it is found near emission sources such as vehicular traffic, certain industries, residential areas, wildfires, slash-and-burn deforestation sites, and grassland burning. Its presence can affect health, particularly the respiratory system, causing everything from reduced lung capacity to pulmonary edema. Chronic exposure to high levels of this and related pollutants can cause cardiovascular issues. It has a fairly short lifespan in the atmosphere, as it quickly reacts with other gases to form ozone (a pollutant that is even more toxic when close to the ground).
When the Mandatory Isolation was decreed in Argentina, we almost immediately had the opportunity to observe, through data from the ESA's (European Space Agency) Sentinel-5p satellite, how nitrogen dioxide levels decreased in the country's main cities. We analyzed pre- and post-lockdown data, as well as data from the previous year, and the decrease was significant. We were able to draw several conclusions: that satellite imagery can be used to perform this type of spatiotemporal analysis; that traffic is the primary source of pollutant emissions in major Argentine cities (Greater Buenos Aires, Córdoba, Mendoza, Rosario, San Miguel de Tucumán); that the atmosphere recovers very quickly when emissions are absent; and that all of this was possible because the population immediately complied with the measure.
It could be said, then, that air quality has undoubtedly improved due to the reduction of traffic on the streets—a direct consequence of the quarantine. However, we must analyze what happens as restrictions are eased and we return to regular activities. If there are no changes in habits regarding the transportation methods we use, it is highly likely that we will return to the previous situation. Here, what environmental institutions can do in terms of emission controls and raising awareness about resource management is crucial, but so is what each of us can do: cycling or walking, using public transit more often, or carpooling to avoid driving with only one or two people per vehicle.
- The National Commission on Space Activities, better known as CONAE, is a National Space Agency responsible for proposing policies for the promotion and execution of space activities for peaceful purposes in productive, scientific, and educational fields, as well as for the creation of innovative national technologies throughout Argentina. You can learn more details about CONAE's work through the following link.
- The researcher in charge of producing the maps and author of the final text is Magister María Fernanda García Ferreyra, air quality expert at the National Commission on Space Activities).
This article was written by Belén Maiztegui. The translation is powered by AI.