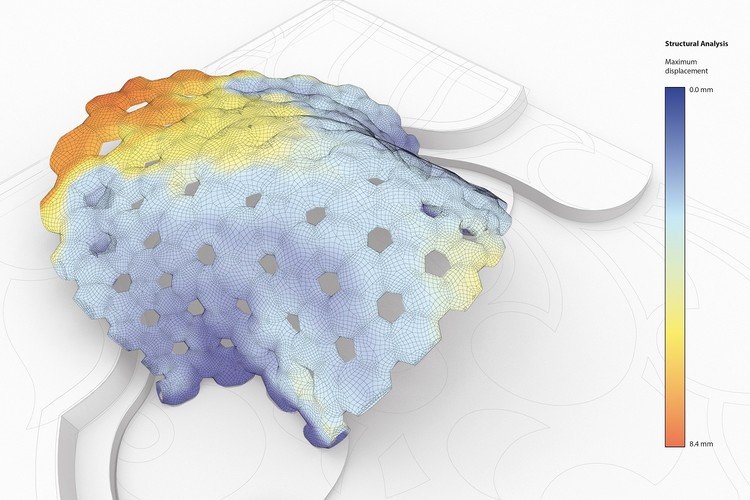
When someone mentions architecture visualization, most immediately think of sketches, computational renderings, and drawings. This connection occurs because we almost always associate visualization with picturing a project that is not yet built, either for the validation of aesthetic and functional decisions or to represent the idea to a client, who is often unfamiliar with technical drawings. Yet in addition to considering superficial elements such as materials, plans, textures, and colors, when carrying out a project, the architect needs to be aware of technical issues that are invisible to the naked eye, which may directly influence the project.

Understanding how heat is transferred between materials and surfaces, how structural efforts are distributed in a support element, and even how sound waves are dissipated in a space is vitally important to improve specifications and avoid future construction problems. But these processes, despite significantly influencing the success of the project and the comfort of its use, are invisible to the eyes. Being able to highlight them in a graphic language can help all parties, including the architects themselves, the engineers, the manufacturers, and even the customers, better understand the project and make better decisions. Usually these graphics are made through color gradients, always accompanied by captions to show numbers and other data, providing beautiful aesthetic results.

Until recently, this type of visualization was mostly used by calculators themselves, generated by their own programs for use. Nowadays, with the dissemination of BIM, where each element in the project can receive specifications of material, resistance, and capacity for sound and heat absorption, this process has become more and more popular. For example, Autodesk recently launched Robot Structural Analysis, a structural load analysis software that is integrated with Revit. For energy simulations, Autodesk provides Energy Analysis, which aims to perform energy analysis on the building design at all stages, from the initial conceptual phase to the detailed design, to ensure that the designer is constantly working towards building with the highest energy efficiency possible.


At Archicad, the GRAPHISOFT EcoDesigner STAR is an extension of ARCHICAD that was developed to serve highly energy efficient building projects, transforming the ARCHICAD Building Information Model (BIM) into Building Energy Models (BEM) of thermal zones. It allows to the user carry out climatic analyses, locating the main sources of energy losses and carrying out energy simulations. Similarly, the widespread Sketchup modeling software Sefaira, which is part of the SketchUp Studio package, allows architects to develop analyses of energy use, daylight, the thermal comfort of the occupants, and several other functions prior to the construction of the building.

Likewise, Cove.tool is an automated sustainability consultant. Its motto is to make the building cost less and perform better. It allows designers to optimize for mass, facade, materials, and more. Plug-ins can be used to bring in software geometries like Revit, Rhinoceros, or Sketchup, or to model the project directly using the simple web interface.

Another example of this type of visualization is the VELUX Daylight Visualizer, a lighting simulation tool for the analysis of natural light conditions in buildings, which assists professionals in predicting and documenting daylight levels as well as the appearance of a space before construction. It accurately simulates and quantifies the levels of daylight indoors, generating reports and explanatory images using these values.
These are just a few examples of software applications that allow for the quantifying of energy, light, and other similar elements, which are all extremely difficult to represent. In the gallery below and in this My ArchDaily folder, readers can find other examples of projects and architects using heat diagrams, structural visualizations, and projections of solar and acoustic radiation.


