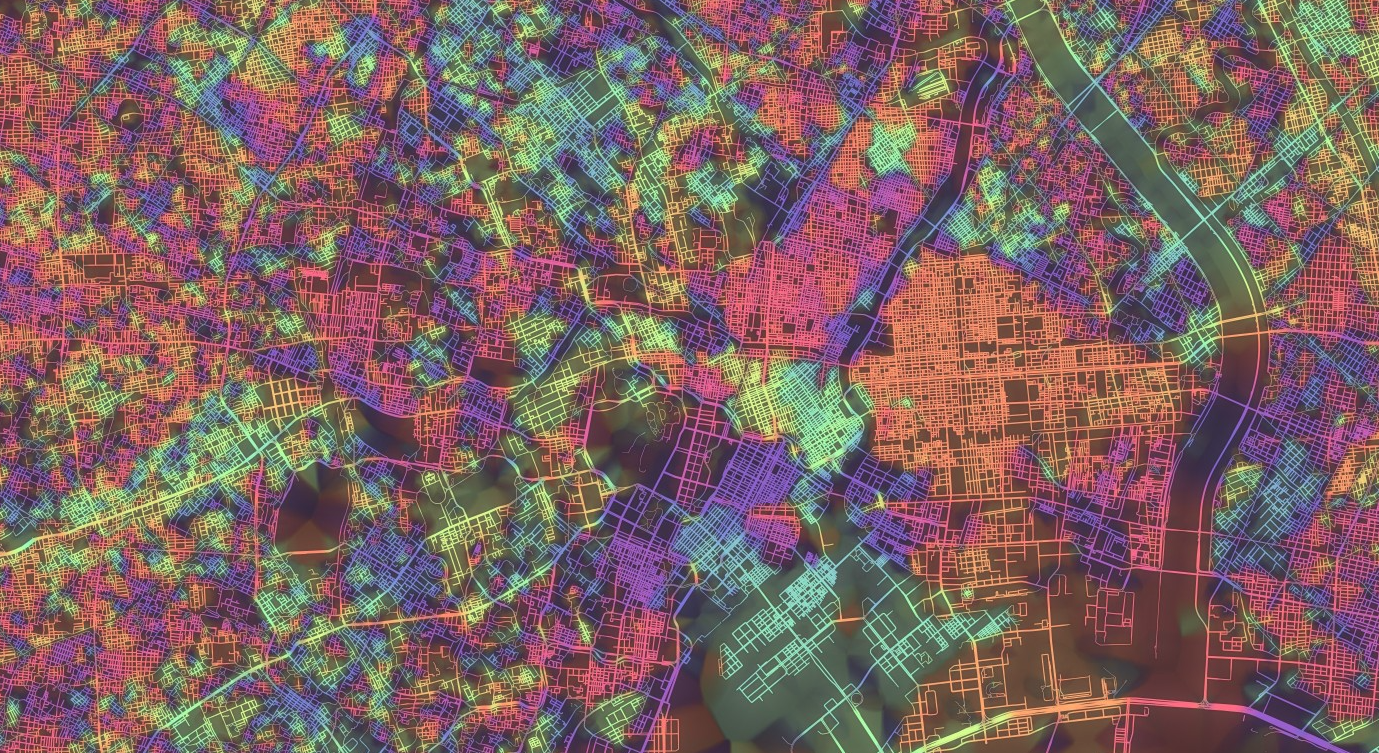
A new series of maps by California-based artist-scientist Stephen Von Worley give colour coding an entirely new meaning. With his latest algorithm-generated project, "Crayon the Grids," Von Worley has taken maps of ten major metropolitan areas and coloured them based on geographical orientation of the urban grid. Each street is assigned a colour specific to its orientation, varying in hue and weight depending on its cardinal direction and length. The result is a dizzying technicolor of urban planning, creating completely new demarcations for some of the world's most recognizable cities.
Enter the chromatic world of coloured city grids after the break

When painted by Von Worley's brush, cities we claim to be familiar with are seen in a new light. Previous delineations made by boroughs, neighbourhoods, and districts are erased in favour of shifts from fuchsia to chartreuse. San Francisco, New York, Paris, Boston, Tokyo, Washington D.C., Chicago, London, Berlin, and Los Angeles appear anew, defined by their patchwork of discombobulated planning. Unsurprisingly, Chicago appears the most uniform, while Paris, shaped by centuries of organic medieval growth with some not-so-subtle interjections by a certain Baron Haussmann, seems much more chaotic.

Von Worley created an intricate method for defining colour choices in each of the cities, based on algorithmic maps drawn by cartographers at MapZen, an open source mapping lab. Derived from a complex formula for assigning colours to data visualization, Von Worley correlated the angle of each street with the cardinal points, subsequently allocating each a unique colour. Then, Von Worley added street length to the mix in order to add visual weight to avenues that serve as anchors of each grid. A host of other factors were considered for each colour, including parallelism and orthogonality, adjacent roads and relationships with neighbouring grids.


History comes alive in Von Worley's maps, offering reminders of Berlin's divisions and Boston's European roots. Gleaming divisions between grids depict the ever-changing nature of urbanism across centuries and cultures, without the comfort of labels and traditional wayfinding. The maps offer a new perspective on some of the world's most famous cities with the help of urban planning and a dash of electrifying colour.

Explore Von Worley's Crayon Grids further on his website.


